|
Download Data (XLS File) |
|
||||||||
|
||||||||
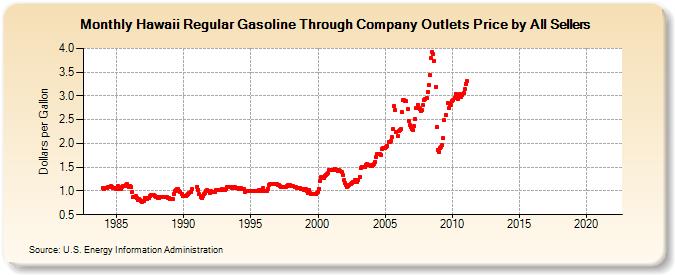
| Hawaii Regular Gasoline Through Company Outlets Price by All Sellers (Dollars per Gallon) | ||||||||
| Year | Jan | Feb | Mar | Apr | May | Jun | Jul | Aug | Sep | Oct | Nov | Dec |
|---|---|---|---|---|---|---|---|---|---|---|---|---|
| 1983 | W | W | W | W | W | W | W | W | W | W | W | W |
| 1984 | 1.069 | 1.043 | 1.060 | 1.068 | 1.077 | 1.086 | 1.093 | 1.102 | 1.090 | 1.068 | 1.055 | 1.047 |
| 1985 | 1.070 | 1.101 | 1.036 | 1.053 | 1.050 | 1.083 | 1.096 | 1.102 | 1.132 | 1.153 | 1.096 | 1.088 |
| 1986 | 1.109 | 1.086 | 0.973 | 0.877 | 0.874 | 0.898 | 0.859 | 0.814 | 0.831 | 0.812 | 0.794 | 0.778 |
| 1987 | 0.780 | 0.861 | 0.859 | 0.829 | 0.857 | 0.846 | 0.887 | 0.911 | 0.908 | 0.909 | 0.889 | 0.878 |
| 1988 | 0.863 | 0.848 | 0.846 | 0.867 | 0.872 | 0.879 | 0.883 | 0.867 | 0.872 | 0.873 | 0.862 | 0.853 |
| 1989 | 0.829 | 0.832 | 0.834 | 0.945 | 0.990 | 1.021 | 1.042 | 1.040 | 0.996 | 0.972 | 0.942 | 0.895 |
| 1990 | 0.898 | 0.896 | 0.903 | 0.919 | 0.929 | 0.965 | 0.987 | 1.034 | W | W | W | W |
| 1991 | 1.091 | 1.027 | 0.930 | 0.869 | 0.849 | 0.896 | 0.936 | 0.960 | 0.994 | 1.011 | 1.009 | 0.963 |
| 1992 | 0.994 | 0.986 | 0.975 | 0.972 | 0.987 | 1.019 | 1.021 | 1.028 | 1.026 | 1.028 | 1.038 | 1.021 |
| 1993 | 1.020 | 1.024 | 1.032 | 1.084 | 1.085 | 1.086 | 1.084 | 1.072 | 1.071 | 1.080 | 1.077 | 1.069 |
| 1994 | 1.053 | 1.043 | 1.050 | 1.055 | 1.041 | 1.041 | 1.040 | 0.987 | 0.991 | 0.997 | 1.004 | 1.000 |
| 1995 | 1.000 | 0.998 | 0.997 | 1.000 | 1.002 | 1.008 | 1.007 | 1.018 | 1.008 | 1.012 | 1.005 | 1.056 |
| 1996 | 0.997 | 1.005 | 1.008 | 1.050 | 1.128 | 1.143 | 1.148 | 1.153 | 1.149 | 1.152 | 1.147 | 1.138 |
| 1997 | 1.129 | 1.127 | 1.108 | 1.091 | 1.081 | 1.077 | 1.086 | 1.090 | 1.107 | 1.115 | 1.108 | 1.119 |
| 1998 | 1.108 | 1.104 | 1.095 | 1.081 | 1.077 | 1.068 | 1.065 | 1.057 | 1.052 | 1.042 | 1.031 | 1.024 |
| 1999 | 1.048 | 1.033 | 1.004 | 0.966 | 1.018 | 0.950 | 0.929 | 0.935 | NA | 0.934 | 0.935 | 0.965 |
| 2000 | 0.976 | 1.051 | 1.217 | 1.293 | 1.283 | 1.283 | 1.324 | 1.339 | 1.360 | 1.388 | 1.435 | 1.445 |
| 2001 | 1.445 | 1.441 | 1.434 | 1.461 | 1.438 | 1.433 | 1.421 | 1.431 | 1.422 | 1.400 | 1.339 | 1.221 |
| 2002 | 1.157 | 1.115 | 1.088 | 1.107 | 1.115 | 1.143 | 1.173 | 1.182 | 1.189 | 1.220 | 1.218 | 1.196 |
| 2003 | 1.220 | 1.296 | 1.475 | 1.514 | 1.511 | 1.506 | 1.511 | 1.536 | 1.568 | 1.554 | 1.542 | 1.521 |
| 2004 | 1.527 | 1.540 | 1.576 | 1.616 | 1.715 | 1.782 | 1.785 | 1.786 | 1.766 | 1.882 | 1.908 | 1.896 |
| 2005 | 1.902 | 1.926 | 1.944 | 2.031 | 2.031 | 2.060 | 2.125 | 2.297 | 2.785 | 2.696 | 2.236 | 2.151 |
| 2006 | 2.258 | 2.278 | 2.296 | 2.652 | 2.910 | 2.905 | 2.896 | 2.884 | 2.715 | 2.479 | 2.380 | 2.350 |
| 2007 | 2.312 | 2.274 | 2.362 | 2.505 | 2.750 | 2.810 | 2.753 | 2.723 | 2.688 | 2.695 | 2.803 | 2.916 |
| 2008 | 2.942 | 2.954 | 3.079 | 3.224 | 3.433 | 3.791 | 3.925 | 3.884 | 3.734 | 3.197 | 2.350 | 1.859 |
| 2009 | 1.826 | 1.904 | 1.933 | 1.969 | 2.113 | 2.496 | 2.596 | NA | 2.843 | 2.737 | 2.836 | 2.809 |
| 2010 | 2.891 | 2.913 | 2.961 | 3.038 | 3.007 | 2.945 | 3.017 | 3.042 | 2.980 | 3.026 | 3.064 | 3.140 |
| 2011 | 3.251 | 3.307 | - | - | - | - | - | - | - | - | - | - |
| 2012 | - | - | - | - | - | - | - | - | - | - | - | - |
| 2013 | - | - | - | - | - | - | - | - | - | - | - | - |
| 2014 | - | - | - | - | - | - | - | - | - | - | - | - |
| 2015 | - | - | - | - | - | - | - | - | - | - | - | - |
| 2016 | - | - | - | - | - | - | - | - | - | - | - | - |
| 2017 | - | - | - | - | - | - | - | - | - | - | - | - |
| 2018 | - | - | - | - | - | - | - | - | - | - | - | - |
| 2019 | - | - | - | - | - | - | - | - | - | - | - | - |
| 2020 | - | - | - | - | - | - | - | - | - | - | - | - |
| 2021 | - | - | - | - | - | - | - | - | - | - | - | - |
| 2022 | - | - | - | |||||||||
| - = No Data Reported; -- = Not Applicable; NA = Not Available; W = Withheld to avoid disclosure of individual company data. |
| Release Date: 6/1/2022 |
| Next Release Date: TBD |