|
Download Data (XLS File) |
|
||||||||
|
||||||||
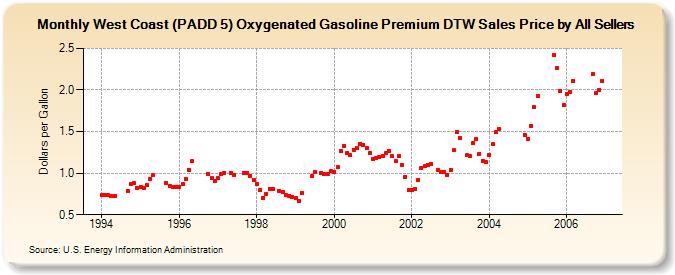
| West Coast (PADD 5) Oxygenated Gasoline Premium DTW Sales Price by All Sellers (Dollars per Gallon) | ||||||||
| Year | Jan | Feb | Mar | Apr | May | Jun | Jul | Aug | Sep | Oct | Nov | Dec |
|---|---|---|---|---|---|---|---|---|---|---|---|---|
| 1994 | 0.732 | 0.733 | 0.733 | 0.723 | 0.728 | W | W | W | 0.787 | 0.872 | 0.878 | 0.820 |
| 1995 | 0.837 | 0.820 | 0.856 | 0.933 | 0.972 | W | NA | NA | 0.883 | 0.848 | 0.835 | 0.831 |
| 1996 | 0.837 | 0.865 | 0.931 | 1.043 | 1.141 | NA | NA | NA | NA | 0.988 | 0.941 | 0.903 |
| 1997 | 0.940 | 0.991 | 1.005 | NA | 1.002 | 0.977 | NA | W | 1.005 | 1.005 | 0.971 | 0.919 |
| 1998 | 0.871 | 0.795 | 0.706 | 0.752 | 0.811 | 0.811 | W | 0.791 | 0.774 | 0.735 | 0.729 | 0.714 |
| 1999 | 0.700 | 0.664 | 0.766 | NA | W | 0.960 | 1.016 | W | 1.005 | 0.987 | 0.994 | 1.021 |
| 2000 | 1.016 | 1.068 | 1.271 | 1.332 | 1.237 | 1.213 | 1.282 | 1.297 | 1.354 | 1.343 | 1.305 | 1.241 |
| 2001 | 1.168 | 1.177 | 1.196 | 1.209 | 1.238 | 1.272 | 1.202 | 1.143 | 1.204 | 1.096 | 0.956 | 0.795 |
| 2002 | 0.797 | 0.810 | 0.915 | 1.066 | 1.082 | 1.102 | 1.106 | NA | 1.042 | 1.008 | 1.017 | 0.981 |
| 2003 | 1.041 | 1.273 | 1.500 | 1.426 | NA | 1.214 | 1.201 | 1.359 | 1.411 | 1.236 | 1.151 | 1.133 |
| 2004 | 1.224 | 1.350 | 1.491 | 1.535 | NA | NA | NA | NA | NA | NA | NA | 1.461 |
| 2005 | 1.411 | 1.571 | 1.792 | 1.933 | W | W | W | W | 2.419 | 2.259 | 1.984 | 1.816 |
| 2006 | 1.953 | 1.978 | 2.112 | W | - | - | - | - | 2.191 | 1.962 | 2.003 | 2.113 |
| - = No Data Reported; -- = Not Applicable; NA = Not Available; W = Withheld to avoid disclosure of individual company data. |
| Release Date: 6/1/2022 |
| Next Release Date: TBD |