|
Download Data (XLS File) |
|
||||||||
|
||||||||
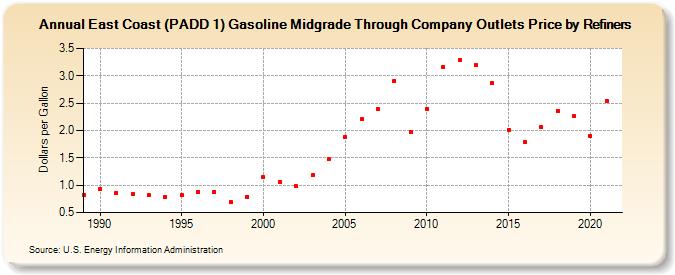
| East Coast (PADD 1) Gasoline Midgrade Through Company Outlets Price by Refiners (Dollars per Gallon) | ||||||||
| Decade | Year-0 | Year-1 | Year-2 | Year-3 | Year-4 | Year-5 | Year-6 | Year-7 | Year-8 | Year-9 |
|---|---|---|---|---|---|---|---|---|---|---|
| 1980's | 0.816 | |||||||||
| 1990's | 0.934 | 0.858 | 0.839 | 0.815 | 0.783 | 0.816 | 0.881 | 0.876 | 0.692 | 0.790 |
| 2000's | 1.149 | 1.059 | 0.979 | 1.179 | 1.471 | 1.882 | 2.205 | 2.389 | 2.895 | 1.973 |
| 2010's | 2.397 | 3.167 | 3.295 | 3.193 | 2.871 | 2.010 | 1.784 | 2.058 | 2.365 | 2.258 |
| 2020's | 1.905 |
| - = No Data Reported; -- = Not Applicable; NA = Not Available; W = Withheld to avoid disclosure of individual company data. |
| Release Date: 6/1/2022 |
| Next Release Date: TBD |