|
Download Data (XLS File) |
|
||||||||
|
||||||||
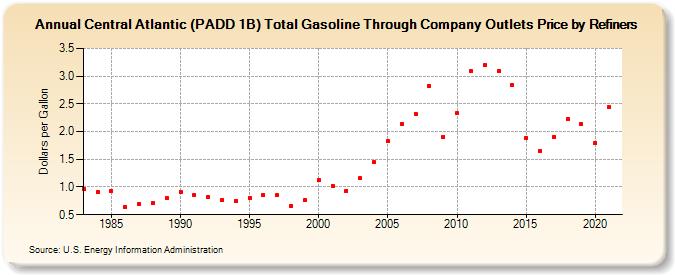
| Central Atlantic (PADD 1B) Total Gasoline Through Company Outlets Price by Refiners (Dollars per Gallon) | ||||||||
| Decade | Year-0 | Year-1 | Year-2 | Year-3 | Year-4 | Year-5 | Year-6 | Year-7 | Year-8 | Year-9 |
|---|---|---|---|---|---|---|---|---|---|---|
| 1980's | 0.972 | 0.912 | 0.929 | 0.643 | 0.695 | 0.708 | 0.802 | |||
| 1990's | 0.910 | 0.858 | 0.815 | 0.772 | 0.755 | 0.807 | 0.855 | 0.852 | 0.662 | 0.757 |
| 2000's | 1.121 | 1.021 | 0.935 | 1.158 | 1.446 | 1.826 | 2.144 | 2.320 | 2.820 | 1.906 |
| 2010's | 2.328 | 3.094 | 3.204 | 3.088 | 2.838 | 1.891 | 1.647 | 1.908 | 2.223 | 2.136 |
| 2020's | 1.793 |
| - = No Data Reported; -- = Not Applicable; NA = Not Available; W = Withheld to avoid disclosure of individual company data. |
| Release Date: 6/1/2022 |
| Next Release Date: TBD |