|
Download Data (XLS File) |
|
||||||||||||
|
||||||||||||
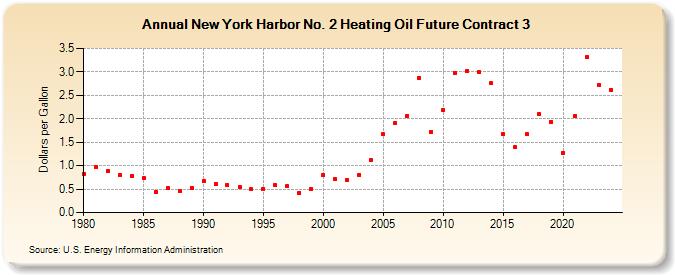
| New York Harbor No. 2 Heating Oil Future Contract 3 (Dollars per Gallon) | ||||||||||||
| Decade | Year-0 | Year-1 | Year-2 | Year-3 | Year-4 | Year-5 | Year-6 | Year-7 | Year-8 | Year-9 |
|---|---|---|---|---|---|---|---|---|---|---|
| 1980's | 0.830 | 0.979 | 0.888 | 0.798 | 0.786 | 0.742 | 0.444 | 0.528 | 0.458 | 0.533 |
| 1990's | 0.672 | 0.604 | 0.590 | 0.549 | 0.496 | 0.499 | 0.583 | 0.565 | 0.418 | 0.500 |
| 2000's | 0.799 | 0.707 | 0.691 | 0.809 | 1.114 | 1.666 | 1.915 | 2.061 | 2.872 | 1.721 |
| 2010's | 2.181 | 2.973 | 3.023 | 2.998 | 2.754 | 1.673 | 1.394 | 1.665 | 2.093 | 1.939 |
| 2020's | 1.280 | 2.062 | 3.315 | 2.719 |
| - = No Data Reported; -- = Not Applicable; NA = Not Available; W = Withheld to avoid disclosure of individual company data. |
| Release Date: 7/24/2024 |
| Next Release Date: 7/31/2024 |