|
Download Data (XLS File) |
|
||||||||||||
|
||||||||||||
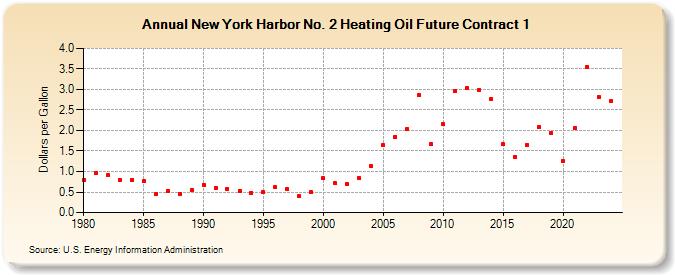
| New York Harbor No. 2 Heating Oil Future Contract 1 (Dollars per Gallon) | ||||||||||||
| Decade | Year-0 | Year-1 | Year-2 | Year-3 | Year-4 | Year-5 | Year-6 | Year-7 | Year-8 | Year-9 |
|---|---|---|---|---|---|---|---|---|---|---|
| 1980's | 0.795 | 0.965 | 0.903 | 0.801 | 0.796 | 0.763 | 0.445 | 0.523 | 0.456 | 0.546 |
| 1990's | 0.679 | 0.609 | 0.577 | 0.531 | 0.485 | 0.496 | 0.612 | 0.564 | 0.398 | 0.494 |
| 2000's | 0.842 | 0.712 | 0.686 | 0.836 | 1.124 | 1.643 | 1.843 | 2.041 | 2.857 | 1.670 |
| 2010's | 2.146 | 2.958 | 3.025 | 2.992 | 2.774 | 1.661 | 1.364 | 1.657 | 2.096 | 1.940 |
| 2020's | 1.249 | 2.069 | 3.549 | 2.814 |
| - = No Data Reported; -- = Not Applicable; NA = Not Available; W = Withheld to avoid disclosure of individual company data. |
| Release Date: 9/18/2024 |
| Next Release Date: 9/25/2024 |