|
Download Data (XLS File) |
|
||||||||
|
||||||||
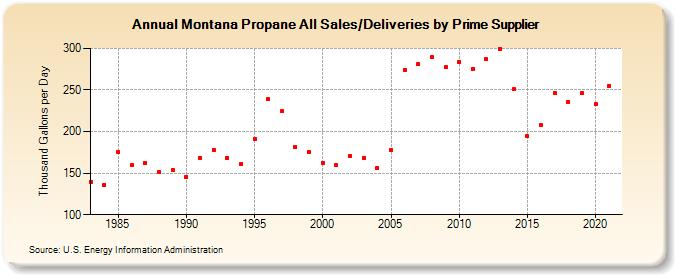
| Montana Propane All Sales/Deliveries by Prime Supplier (Thousand Gallons per Day) | ||||||||
| Decade | Year-0 | Year-1 | Year-2 | Year-3 | Year-4 | Year-5 | Year-6 | Year-7 | Year-8 | Year-9 |
|---|---|---|---|---|---|---|---|---|---|---|
| 1980's | 139.5 | 136.2 | 175.8 | 159.7 | 162.0 | 151.5 | 154.2 | |||
| 1990's | 145.2 | 168.6 | 178.4 | 168.5 | 160.7 | 191.4 | 239.0 | 224.4 | 181.3 | 175.5 |
| 2000's | 162.5 | 159.4 | 171.2 | 168.4 | 156.1 | 178.1 | 274.6 | 280.7 | 289.5 | 277.2 |
| 2010's | 284.1 | 275.2 | 287.2 | 299.8 | 250.7 | 194.1 | 207.8 | 246.4 | 235.8 | 245.9 |
| 2020's | 232.6 |
| - = No Data Reported; -- = Not Applicable; NA = Not Available; W = Withheld to avoid disclosure of individual company data. |
| Release Date: 6/1/2022 |
| Next Release Date: TBD |