|
Download Data (XLS File) |
|
||||||||
|
||||||||
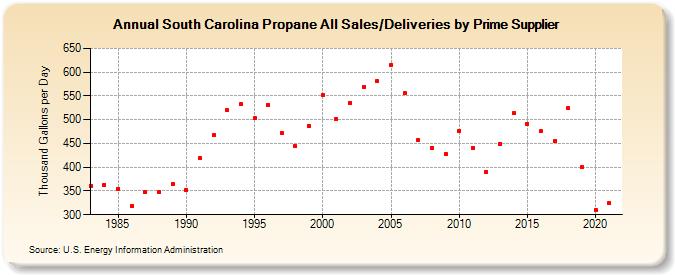
| South Carolina Propane All Sales/Deliveries by Prime Supplier (Thousand Gallons per Day) | ||||||||
| Decade | Year-0 | Year-1 | Year-2 | Year-3 | Year-4 | Year-5 | Year-6 | Year-7 | Year-8 | Year-9 |
|---|---|---|---|---|---|---|---|---|---|---|
| 1980's | 361.4 | 363.5 | 354.3 | 318.8 | 347.2 | 347.2 | 364.6 | |||
| 1990's | 352.5 | 418.5 | 467.3 | 519.7 | 532.4 | 503.1 | 531.8 | 471.9 | 444.2 | 486.6 |
| 2000's | 552.1 | 501.5 | 535.9 | 569.8 | 580.8 | 615.8 | 555.5 | 457.6 | 441.3 | 428.2 |
| 2010's | 476.4 | 440.6 | 390.9 | 449.5 | 514.4 | 491.9 | 475.2 | 455.5 | 523.6 | 399.4 |
| 2020's | 310.3 |
| - = No Data Reported; -- = Not Applicable; NA = Not Available; W = Withheld to avoid disclosure of individual company data. |
| Release Date: 6/1/2022 |
| Next Release Date: TBD |