|
Download Data (XLS File) |
|
||||||||
|
||||||||
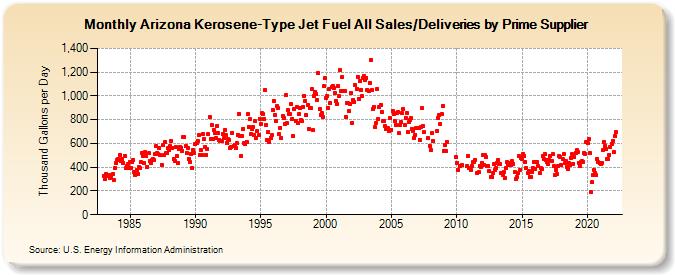
| Arizona Kerosene-Type Jet Fuel All Sales/Deliveries by Prime Supplier (Thousand Gallons per Day) | ||||||||
| Year | Jan | Feb | Mar | Apr | May | Jun | Jul | Aug | Sep | Oct | Nov | Dec |
|---|---|---|---|---|---|---|---|---|---|---|---|---|
| 1983 | 329.5 | 299.1 | 343.3 | W | 325.5 | 336.2 | 311.6 | 319.9 | 342.6 | 293.1 | 391.6 | 431.4 |
| 1984 | 462.6 | 467.8 | 461.8 | 501.5 | 449.0 | 470.0 | 437.9 | 497.1 | 390.9 | 408.1 | 427.7 | 396.7 |
| 1985 | 446.3 | 395.6 | 441.2 | 464.7 | 360.0 | 331.9 | 376.5 | 344.4 | 398.2 | 394.1 | 440.0 | 523.4 |
| 1986 | 495.6 | 433.3 | 525.0 | 493.0 | 403.7 | 517.3 | 451.7 | 439.5 | 461.6 | 470.7 | 458.7 | 510.1 |
| 1987 | 575.2 | 518.0 | 509.5 | 557.4 | 499.8 | 422.1 | 584.5 | 500.6 | 613.0 | 518.2 | 517.2 | 559.3 |
| 1988 | 541.9 | 576.9 | 619.9 | 564.6 | 470.5 | 453.7 | 572.5 | 497.5 | 433.4 | 555.0 | 572.6 | 565.7 |
| 1989 | 538.5 | 655.6 | 652.2 | 576.0 | 518.8 | 564.8 | 472.5 | 439.6 | 509.3 | 394.1 | 543.4 | 518.5 |
| 1990 | 595.8 | 599.9 | 622.9 | 667.8 | 505.3 | 540.8 | 499.2 | 680.9 | 637.6 | 573.3 | 505.1 | 550.0 |
| 1991 | 677.0 | 822.8 | 637.7 | 759.1 | 634.2 | 712.7 | 685.3 | 645.3 | 750.5 | 689.8 | 631.2 | 617.3 |
| 1992 | 623.5 | 682.6 | 643.2 | 712.9 | 668.5 | 605.5 | 635.1 | 630.9 | 558.8 | 573.5 | 690.5 | 580.4 |
| 1993 | 590.2 | 559.1 | 605.9 | 673.7 | 848.9 | 659.8 | 492.5 | 666.0 | 723.6 | 602.6 | 591.3 | 613.2 |
| 1994 | 845.1 | 739.4 | 802.4 | 680.6 | 723.3 | 741.1 | 671.0 | 786.7 | 647.3 | 703.3 | 667.0 | 806.4 |
| 1995 | 765.0 | 853.0 | 843.6 | 807.3 | 1,050.9 | 758.3 | 629.4 | 697.1 | 615.0 | 645.3 | 667.6 | 885.3 |
| 1996 | 955.2 | 835.7 | 791.5 | 912.7 | 896.8 | 676.5 | 734.1 | 644.5 | 826.9 | 813.6 | 765.3 | 1,005.4 |
| 1997 | 768.8 | 881.1 | 849.9 | 844.4 | 928.2 | 809.1 | 664.4 | 890.3 | 792.2 | 904.3 | 770.0 | 845.0 |
| 1998 | 899.3 | 798.7 | 784.7 | 910.3 | 1,003.0 | 958.4 | 837.9 | 921.4 | 725.2 | 899.0 | 899.6 | 1,057.5 |
| 1999 | 710.3 | 1,002.0 | 1,030.3 | 1,012.0 | 967.8 | 1,189.0 | 889.1 | 841.6 | 856.2 | 825.9 | 1,079.4 | 1,148.7 |
| 2000 | 982.6 | 1,002.4 | 898.0 | 1,060.0 | 939.1 | 1,071.7 | 1,086.6 | 1,062.7 | 1,024.3 | 961.1 | 933.9 | 1,081.9 |
| 2001 | 997.1 | 1,214.0 | 1,037.6 | 1,160.4 | 1,044.5 | 1,044.5 | 825.9 | 943.1 | 938.0 | 872.4 | 936.1 | 1,024.4 |
| 2002 | 773.2 | 968.3 | 947.1 | 1,089.7 | 1,061.5 | 1,162.2 | 977.7 | 1,129.4 | 1,053.1 | 998.9 | 1,154.3 | 1,168.9 |
| 2003 | 1,131.3 | 1,153.3 | 1,053.8 | 1,042.8 | 1,110.2 | 1,302.8 | 1,050.7 | 892.5 | 906.9 | 735.8 | 773.6 | 1,059.1 |
| 2004 | 806.0 | 907.3 | 926.2 | 863.8 | 790.3 | 789.7 | 747.4 | 720.3 | 722.8 | 727.3 | 703.8 | 813.1 |
| 2005 | 716.0 | 872.6 | 846.8 | 785.7 | 755.4 | 852.2 | 865.8 | 686.2 | 756.6 | 776.6 | 852.3 | 887.1 |
| 2006 | 758.2 | 816.6 | 858.4 | 695.2 | 778.7 | 799.6 | 811.3 | 723.0 | 708.2 | 641.9 | 674.4 | 728.1 |
| 2007 | 728.5 | 728.0 | 631.2 | 734.2 | 894.5 | 746.6 | 692.9 | W | W | W | 642.4 | 579.8 |
| 2008 | 546.4 | 684.4 | 622.9 | W | W | W | 708.3 | 813.7 | 838.8 | 763.3 | 846.6 | 915.5 |
| 2009 | 536.6 | 584.0 | 533.1 | 614.6 | W | W | W | W | W | W | W | 489.2 |
| 2010 | 437.4 | 378.7 | W | 413.8 | W | 417.7 | W | W | W | 406.5 | 491.8 | 391.4 |
| 2011 | W | 378.6 | 412.1 | 441.3 | 439.8 | 463.5 | W | 353.9 | 359.0 | 413.4 | 404.1 | 437.2 |
| 2012 | 501.3 | 416.2 | 500.2 | 485.8 | 407.8 | 410.6 | 365.2 | 316.6 | 320.6 | 349.5 | 424.7 | 376.9 |
| 2013 | 395.8 | 434.3 | 462.0 | 426.7 | 423.9 | 352.4 | 338.4 | 357.7 | 307.7 | 395.0 | 443.1 | 428.2 |
| 2014 | 414.3 | 438.9 | 415.5 | 449.5 | 427.5 | 357.8 | 301.3 | 315.6 | 352.1 | 493.4 | 375.2 | 476.5 |
| 2015 | 466.6 | 510.1 | 497.0 | 445.4 | 393.7 | 347.7 | 371.6 | 319.5 | 315.9 | 356.6 | 391.1 | 440.8 |
| 2016 | 387.9 | 444.1 | 442.4 | 409.4 | 353.0 | 391.9 | 383.3 | 495.8 | 470.5 | 508.0 | 457.8 | 445.2 |
| 2017 | 429.8 | 458.2 | 494.3 | 456.0 | 507.4 | 406.6 | 336.3 | 378.5 | 343.0 | 413.4 | 498.1 | 483.9 |
| 2018 | 420.2 | 468.5 | 512.5 | 432.4 | 449.4 | 399.9 | 383.5 | 432.7 | 415.2 | 477.0 | 507.8 | 429.9 |
| 2019 | 486.2 | 523.0 | 542.5 | 525.2 | 439.4 | 410.5 | 440.5 | 448.4 | 447.7 | 520.9 | 514.2 | 612.5 |
| 2020 | 607.1 | 633.8 | 520.5 | 187.8 | 271.8 | 332.9 | 380.3 | 351.9 | 331.6 | 469.8 | 441.8 | 434.3 |
| 2021 | 426.6 | 433.4 | 542.2 | 615.8 | 579.8 | 556.7 | 469.3 | 471.8 | 500.9 | 573.8 | 597.7 | 622.1 |
| 2022 | 524.6 | 662.4 | 692.9 | |||||||||
| - = No Data Reported; -- = Not Applicable; NA = Not Available; W = Withheld to avoid disclosure of individual company data. |
| Release Date: 5/19/2022 |
| Next Release Date: TBD |