|
Download Data (XLS File) |
|
||||||||
|
||||||||
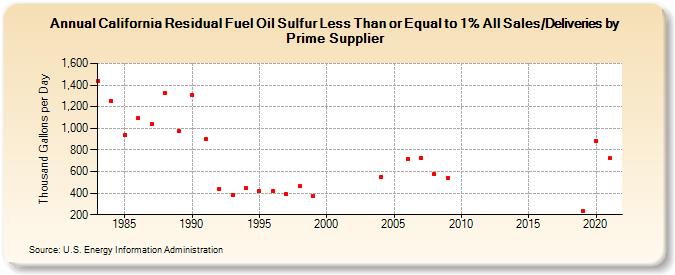
| California Residual Fuel Oil Sulfur Less Than or Equal to 1% All Sales/Deliveries by Prime Supplier (Thousand Gallons per Day) | ||||||||
| Decade | Year-0 | Year-1 | Year-2 | Year-3 | Year-4 | Year-5 | Year-6 | Year-7 | Year-8 | Year-9 |
|---|---|---|---|---|---|---|---|---|---|---|
| 1980's | 1,433.8 | 1,249.2 | 939.7 | 1,091.0 | 1,038.0 | 1,327.2 | 974.9 | |||
| 1990's | 1,305.6 | 899.4 | 438.1 | 380.5 | 443.4 | 415.2 | 415.5 | 391.1 | 462.9 | 370.6 |
| 2000's | W | W | W | W | 544.6 | W | 711.8 | 727.6 | 575.8 | 543.0 |
| 2010's | W | W | W | W | W | W | W | W | W | 238.6 |
| 2020's | 881.4 |
| - = No Data Reported; -- = Not Applicable; NA = Not Available; W = Withheld to avoid disclosure of individual company data. |
| Release Date: 6/1/2022 |
| Next Release Date: TBD |