|
Download Data (XLS File) |
|
||||||||
|
||||||||
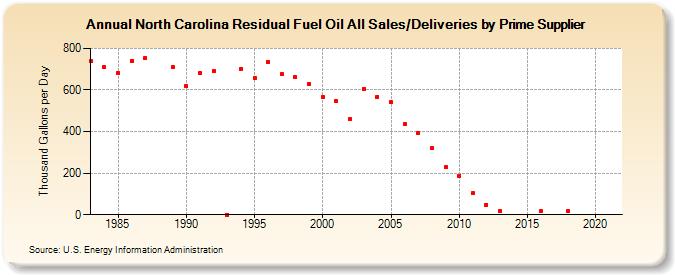
| North Carolina Residual Fuel Oil All Sales/Deliveries by Prime Supplier (Thousand Gallons per Day) | ||||||||
| Decade | Year-0 | Year-1 | Year-2 | Year-3 | Year-4 | Year-5 | Year-6 | Year-7 | Year-8 | Year-9 |
|---|---|---|---|---|---|---|---|---|---|---|
| 1980's | 738.6 | 708.3 | 682.9 | 741.7 | 753.0 | W | 711.5 | |||
| 1990's | 617.9 | 681.3 | 691.3 | 0.0 | 701.8 | 659.3 | 734.5 | 677.6 | 660.5 | 629.4 |
| 2000's | 567.3 | 544.9 | 459.6 | 606.6 | 568.2 | 540.9 | 434.0 | 395.0 | 319.9 | 227.7 |
| 2010's | 188.6 | 102.2 | 49.1 | 17.7 | W | W | 17.7 | W | 16.3 | W |
| 2020's | W |
| - = No Data Reported; -- = Not Applicable; NA = Not Available; W = Withheld to avoid disclosure of individual company data. |
| Release Date: 6/1/2022 |
| Next Release Date: TBD |