|
Download Data (XLS File) |
|
||||||||
|
||||||||
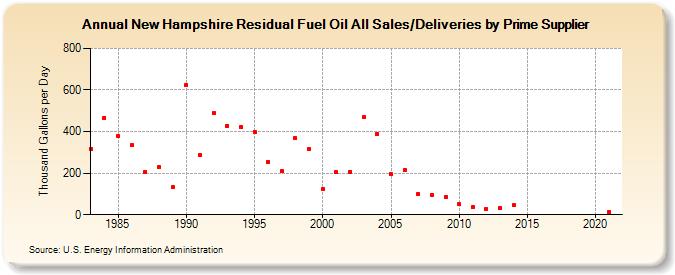
| New Hampshire Residual Fuel Oil All Sales/Deliveries by Prime Supplier (Thousand Gallons per Day) | ||||||||
| Decade | Year-0 | Year-1 | Year-2 | Year-3 | Year-4 | Year-5 | Year-6 | Year-7 | Year-8 | Year-9 |
|---|---|---|---|---|---|---|---|---|---|---|
| 1980's | 317.9 | 466.8 | 379.4 | 334.8 | 207.7 | 229.2 | 133.0 | |||
| 1990's | 622.9 | 285.5 | 490.0 | 428.8 | 422.5 | 399.9 | 252.6 | 209.6 | 367.9 | 315.2 |
| 2000's | 123.5 | 203.4 | 206.5 | 468.6 | 386.9 | 193.5 | 215.7 | 100.5 | 95.0 | 85.4 |
| 2010's | 49.5 | 36.0 | 27.9 | 31.9 | 45.2 | W | W | W | W | W |
| 2020's | W |
| - = No Data Reported; -- = Not Applicable; NA = Not Available; W = Withheld to avoid disclosure of individual company data. |
| Release Date: 6/1/2022 |
| Next Release Date: TBD |