|
Download Data (XLS File) |
|
||||||||
|
||||||||
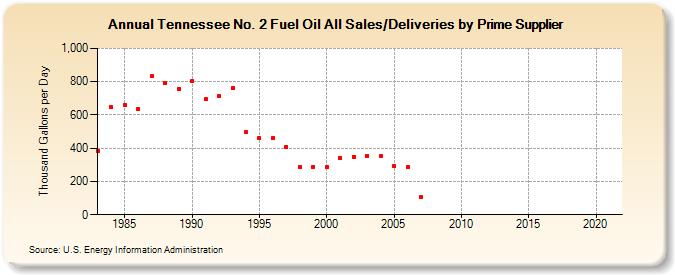
| Tennessee No. 2 Fuel Oil All Sales/Deliveries by Prime Supplier (Thousand Gallons per Day) | ||||||||
| Decade | Year-0 | Year-1 | Year-2 | Year-3 | Year-4 | Year-5 | Year-6 | Year-7 | Year-8 | Year-9 |
|---|---|---|---|---|---|---|---|---|---|---|
| 1980's | 381.9 | 644.8 | 660.3 | 636.9 | 831.5 | 792.1 | 758.3 | |||
| 1990's | 802.0 | 693.2 | 712.6 | 760.5 | 495.2 | 462.1 | 462.6 | 408.2 | 286.2 | 289.3 |
| 2000's | 285.7 | 340.1 | 349.7 | 353.4 | 351.1 | 293.7 | 285.3 | 105.3 | W | W |
| 2010's | W | W | W | W | - | - | - | - | - | - |
| 2020's | - |
| - = No Data Reported; -- = Not Applicable; NA = Not Available; W = Withheld to avoid disclosure of individual company data. |
| Release Date: 6/1/2022 |
| Next Release Date: TBD |