|
Download Data (XLS File) |
|
||||||||
|
||||||||
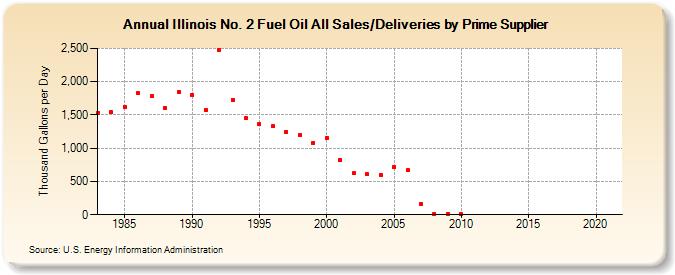
| Illinois No. 2 Fuel Oil All Sales/Deliveries by Prime Supplier (Thousand Gallons per Day) | ||||||||
| Decade | Year-0 | Year-1 | Year-2 | Year-3 | Year-4 | Year-5 | Year-6 | Year-7 | Year-8 | Year-9 |
|---|---|---|---|---|---|---|---|---|---|---|
| 1980's | 1,530.0 | 1,538.7 | 1,619.4 | 1,822.8 | 1,779.3 | 1,607.7 | 1,849.2 | |||
| 1990's | 1,806.7 | 1,574.4 | 2,482.5 | 1,727.2 | 1,449.7 | 1,362.5 | 1,326.8 | 1,249.4 | 1,196.6 | 1,085.0 |
| 2000's | 1,160.2 | 824.6 | 621.6 | 606.9 | 601.1 | 715.6 | 671.2 | 161.6 | 15.3 | 14.6 |
| 2010's | 6.7 | W | - | - | - | - | - | - | - | - |
| 2020's | - |
| - = No Data Reported; -- = Not Applicable; NA = Not Available; W = Withheld to avoid disclosure of individual company data. |
| Release Date: 6/1/2022 |
| Next Release Date: TBD |