|
Download Data (XLS File) |
|
||||||||
|
||||||||
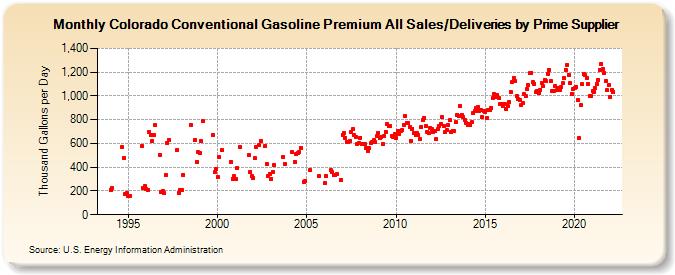
| Colorado Conventional Gasoline Premium All Sales/Deliveries by Prime Supplier (Thousand Gallons per Day) | ||||||||
| Year | Jan | Feb | Mar | Apr | May | Jun | Jul | Aug | Sep | Oct | Nov | Dec |
|---|---|---|---|---|---|---|---|---|---|---|---|---|
| 1993 | NA | NA | NA | |||||||||
| 1994 | 211.0 | 224.5 | W | W | W | W | W | W | 570.9 | 477.7 | 177.5 | 180.9 |
| 1995 | 159.6 | 160.7 | W | W | W | W | W | W | W | 579.5 | 222.6 | 237.7 |
| 1996 | 214.4 | 207.8 | 696.6 | 673.4 | 622.5 | 671.4 | 752.5 | W | W | 505.4 | 191.9 | 196.3 |
| 1997 | 184.1 | 335.5 | 600.2 | 629.0 | W | W | W | W | W | 543.0 | 185.5 | 210.0 |
| 1998 | 206.3 | 334.7 | W | W | W | W | 758.5 | W | W | 628.2 | 446.0 | 524.7 |
| 1999 | 521.9 | 616.4 | 785.6 | W | W | W | W | W | W | 670.3 | 356.9 | 381.2 |
| 2000 | 319.5 | 485.4 | W | 545.7 | W | W | W | W | W | 445.9 | 304.4 | 322.2 |
| 2001 | 300.0 | 393.4 | W | 566.1 | W | W | W | W | W | 503.5 | 356.3 | 322.7 |
| 2002 | 310.3 | 474.8 | 573.0 | W | 585.1 | 620.4 | W | W | 579.9 | 428.8 | 326.4 | 344.3 |
| 2003 | 302.0 | 358.4 | 418.5 | W | W | W | W | W | 486.2 | 428.7 | W | W |
| 2004 | W | W | 525.8 | W | 446.4 | 506.9 | 519.8 | 524.0 | 562.5 | W | 277.9 | 281.4 |
| 2005 | W | W | 372.8 | W | W | W | W | W | 324.8 | W | W | W |
| 2006 | 267.1 | 326.2 | W | W | 372.5 | 357.9 | 330.9 | 332.1 | 341.7 | W | W | 294.6 |
| 2007 | 674.5 | 687.0 | 649.0 | 610.9 | 610.1 | 623.4 | 697.8 | 721.3 | 670.2 | 654.4 | 592.7 | 602.6 |
| 2008 | 649.6 | 593.1 | 595.1 | 595.2 | 563.4 | 539.1 | 561.2 | 600.1 | 608.1 | 625.5 | 611.4 | 659.9 |
| 2009 | 691.2 | 643.8 | 655.3 | 595.1 | 661.7 | 696.9 | 759.5 | 749.2 | 745.0 | 665.0 | 658.0 | 680.5 |
| 2010 | 646.4 | 703.5 | 683.1 | 705.6 | 713.0 | 758.5 | 829.8 | 772.0 | 773.1 | 737.3 | 621.9 | 724.9 |
| 2011 | 689.4 | 667.1 | 687.1 | 671.5 | 636.6 | 742.3 | 793.9 | 818.0 | 745.4 | 699.8 | 690.7 | 729.3 |
| 2012 | 718.7 | 698.3 | 701.8 | 633.2 | 718.3 | 750.8 | 766.5 | 821.8 | 750.7 | 696.5 | 711.7 | 756.9 |
| 2013 | 795.7 | 698.5 | 707.2 | 708.4 | 777.7 | 842.2 | 831.9 | 915.2 | 843.0 | 822.5 | 798.5 | 775.0 |
| 2014 | 757.4 | 760.0 | 752.1 | 777.3 | 853.9 | 872.2 | 894.5 | 908.3 | 871.5 | 877.4 | 823.9 | 872.8 |
| 2015 | 864.9 | 817.6 | 884.1 | 879.8 | 901.4 | 984.7 | 1,019.3 | 994.3 | 1,009.5 | 981.0 | 933.9 | 935.1 |
| 2016 | 918.4 | 928.1 | 886.9 | 912.2 | 952.0 | 1,031.1 | 1,118.6 | 1,151.0 | 1,125.5 | 997.2 | 973.9 | 967.2 |
| 2017 | 920.4 | 942.1 | 1,017.5 | 999.0 | 1,059.3 | 1,089.6 | 1,190.1 | 1,195.9 | 1,113.8 | 1,103.3 | 1,036.7 | 1,044.2 |
| 2018 | 1,021.5 | 1,053.1 | 1,112.3 | 1,081.2 | 1,136.7 | 1,124.8 | 1,187.6 | 1,218.2 | 1,123.0 | 1,038.5 | 1,045.5 | 1,083.1 |
| 2019 | 1,045.8 | 1,064.6 | 1,051.2 | 1,072.6 | 1,105.7 | 1,152.6 | 1,221.1 | 1,261.8 | 1,178.5 | 1,104.9 | 1,020.0 | 1,059.1 |
| 2020 | 1,064.6 | 1,077.6 | 964.2 | 642.7 | 921.3 | 1,096.6 | 1,186.0 | 1,171.9 | 1,153.8 | 1,103.0 | 1,000.2 | 999.5 |
| 2021 | 1,038.7 | 1,035.7 | 1,065.3 | 1,101.2 | 1,138.1 | 1,221.4 | 1,271.5 | 1,230.2 | 1,193.1 | 1,129.7 | 1,046.9 | 1,088.5 |
| 2022 | 994.5 | 1,051.3 | 1,035.5 | |||||||||
| - = No Data Reported; -- = Not Applicable; NA = Not Available; W = Withheld to avoid disclosure of individual company data. |
| Release Date: 5/19/2022 |
| Next Release Date: TBD |