|
Download Data (XLS File) |
|
||||||||
|
||||||||
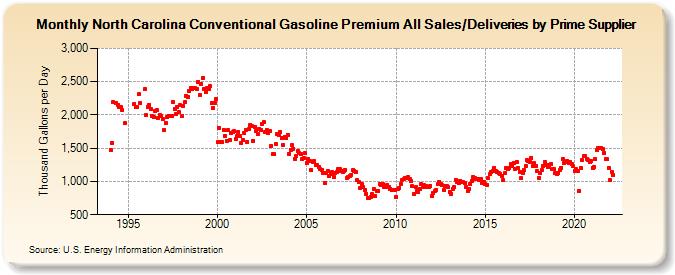
| North Carolina Conventional Gasoline Premium All Sales/Deliveries by Prime Supplier (Thousand Gallons per Day) | ||||||||
| Year | Jan | Feb | Mar | Apr | May | Jun | Jul | Aug | Sep | Oct | Nov | Dec |
|---|---|---|---|---|---|---|---|---|---|---|---|---|
| 1993 | NA | NA | NA | |||||||||
| 1994 | 1,470.2 | 1,582.8 | 2,191.1 | W | 2,185.3 | 2,156.4 | 2,120.1 | 2,118.6 | 2,072.4 | W | 1,875.5 | W |
| 1995 | W | W | W | W | 2,167.2 | 2,126.1 | 2,116.9 | 2,311.9 | 2,173.5 | W | W | 2,383.5 |
| 1996 | 1,992.2 | 2,123.0 | 2,153.0 | 2,094.6 | 1,987.3 | 1,962.1 | 2,060.9 | 2,069.1 | 1,961.1 | 1,997.2 | 1,984.0 | 1,932.2 |
| 1997 | 1,777.8 | 1,879.7 | 1,961.4 | 1,990.2 | 1,986.9 | 1,980.2 | 2,188.9 | 2,087.8 | 2,013.5 | 2,116.4 | 2,045.7 | 2,144.8 |
| 1998 | 1,978.3 | 2,136.4 | 2,189.3 | 2,290.2 | 2,274.2 | 2,356.4 | 2,410.7 | 2,382.7 | 2,399.1 | 2,397.9 | 2,395.4 | 2,495.8 |
| 1999 | 2,297.9 | 2,470.3 | 2,553.6 | 2,390.5 | 2,337.5 | 2,408.0 | 2,388.1 | 2,430.7 | 2,175.3 | 2,109.4 | 2,186.6 | 2,240.5 |
| 2000 | 1,592.2 | 1,810.6 | 1,593.3 | 1,592.5 | 1,777.1 | 1,688.3 | 1,609.3 | 1,769.2 | 1,618.9 | 1,725.1 | 1,738.5 | 1,754.4 |
| 2001 | 1,633.8 | 1,679.0 | 1,744.7 | 1,679.2 | 1,578.2 | 1,627.3 | 1,725.5 | 1,778.7 | 1,593.8 | 1,789.6 | 1,853.4 | 1,835.2 |
| 2002 | 1,615.5 | 1,824.9 | 1,759.1 | 1,715.7 | 1,789.8 | 1,779.4 | 1,869.8 | 1,892.8 | 1,740.6 | 1,776.2 | 1,723.5 | 1,753.7 |
| 2003 | 1,534.5 | 1,409.7 | 1,405.2 | 1,555.5 | 1,705.8 | 1,700.4 | 1,740.7 | 1,651.7 | 1,553.8 | 1,666.3 | 1,648.6 | 1,704.4 |
| 2004 | 1,418.9 | 1,474.8 | 1,541.4 | 1,493.1 | 1,337.2 | 1,376.9 | 1,461.2 | 1,426.5 | 1,414.2 | 1,330.9 | 1,347.6 | 1,422.0 |
| 2005 | 1,275.8 | 1,338.4 | 1,301.9 | 1,169.2 | 1,297.9 | 1,300.1 | 1,252.5 | 1,244.8 | 1,223.8 | 1,183.3 | 1,176.7 | 1,134.4 |
| 2006 | 981.5 | 1,133.3 | 1,159.1 | 1,084.3 | 1,104.5 | 1,138.1 | 1,064.3 | 1,123.7 | 1,145.1 | 1,186.0 | 1,185.1 | 1,162.4 |
| 2007 | 1,144.4 | 1,160.4 | 1,174.6 | 1,053.0 | 1,067.2 | 1,089.3 | 1,101.3 | 1,167.5 | 1,157.3 | 1,140.3 | 1,017.7 | 991.2 |
| 2008 | 904.9 | 955.4 | 912.6 | 876.7 | 812.1 | 749.1 | 747.1 | 768.2 | 812.9 | 886.0 | 778.3 | 858.5 |
| 2009 | 857.5 | 958.0 | 940.7 | 960.8 | 912.5 | 917.7 | 949.7 | 918.9 | 890.5 | 876.7 | 864.7 | 864.7 |
| 2010 | 768.5 | 879.7 | 906.5 | 963.1 | 1,025.7 | 1,030.7 | 1,059.1 | 1,048.5 | 1,065.3 | 1,031.2 | 999.4 | 927.9 |
| 2011 | 816.9 | 910.2 | 858.3 | 846.3 | 882.9 | 961.5 | 910.0 | 944.8 | 929.8 | 921.0 | 916.9 | 935.2 |
| 2012 | 784.6 | 829.5 | 849.8 | 873.9 | 954.4 | 995.7 | 954.9 | 945.0 | 878.8 | 924.3 | 930.1 | 909.5 |
| 2013 | 844.3 | 816.8 | 888.7 | 916.9 | 1,023.4 | 992.4 | 972.9 | 1,011.3 | 985.0 | 987.9 | 978.0 | 921.5 |
| 2014 | 853.4 | 886.8 | 958.3 | 1,005.9 | 1,072.4 | 1,046.5 | 1,035.1 | 1,037.0 | 1,027.5 | 1,040.3 | 977.5 | 998.2 |
| 2015 | 956.7 | 943.3 | 1,047.3 | 1,107.6 | 1,141.5 | 1,162.4 | 1,207.2 | 1,151.8 | 1,146.3 | 1,122.7 | 1,112.4 | 1,083.0 |
| 2016 | 1,017.2 | 1,122.2 | 1,204.5 | 1,187.5 | 1,207.5 | 1,259.7 | 1,232.1 | 1,283.5 | 1,186.7 | 1,297.5 | 1,199.0 | 1,146.7 |
| 2017 | 1,048.1 | 1,125.8 | 1,170.5 | 1,226.4 | 1,320.0 | 1,309.4 | 1,293.3 | 1,359.7 | 1,230.4 | 1,271.1 | 1,239.1 | 1,150.4 |
| 2018 | 1,058.5 | 1,131.2 | 1,166.5 | 1,228.0 | 1,293.4 | 1,245.9 | 1,224.6 | 1,253.8 | 1,260.4 | 1,192.8 | 1,183.9 | 1,123.4 |
| 2019 | 1,104.5 | 1,122.5 | 1,167.7 | 1,206.1 | 1,343.9 | 1,282.0 | 1,290.7 | 1,308.0 | 1,283.9 | 1,294.8 | 1,260.3 | 1,227.9 |
| 2020 | 1,153.8 | 1,181.8 | 1,157.4 | 858.9 | 1,199.1 | 1,317.6 | 1,381.2 | 1,379.5 | 1,343.5 | 1,322.2 | 1,289.6 | 1,307.9 |
| 2021 | 1,205.9 | 1,222.7 | 1,336.1 | 1,474.6 | 1,499.0 | 1,502.2 | 1,509.6 | 1,492.4 | 1,425.0 | 1,335.2 | 1,331.1 | 1,207.7 |
| 2022 | 1,016.6 | 1,142.3 | 1,103.6 | |||||||||
| - = No Data Reported; -- = Not Applicable; NA = Not Available; W = Withheld to avoid disclosure of individual company data. |
| Release Date: 5/19/2022 |
| Next Release Date: TBD |