|
Download Data (XLS File) |
|
||||||||
|
||||||||
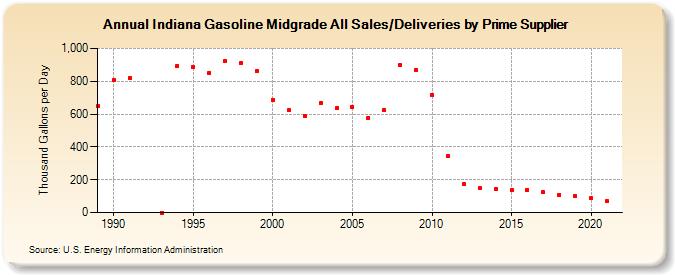
| Indiana Gasoline Midgrade All Sales/Deliveries by Prime Supplier (Thousand Gallons per Day) | ||||||||
| Decade | Year-0 | Year-1 | Year-2 | Year-3 | Year-4 | Year-5 | Year-6 | Year-7 | Year-8 | Year-9 |
|---|---|---|---|---|---|---|---|---|---|---|
| 1980's | 648.1 | |||||||||
| 1990's | 807.9 | 818.9 | W | 0.0 | 892.7 | 885.2 | 851.7 | 920.2 | 910.9 | 863.5 |
| 2000's | 687.6 | 622.6 | 589.6 | 666.4 | 634.8 | 643.0 | 577.4 | 624.2 | 899.6 | 870.9 |
| 2010's | 718.3 | 344.3 | 171.2 | 147.9 | 141.4 | 139.2 | 138.4 | 123.3 | 109.7 | 100.5 |
| 2020's | 87.9 |
| - = No Data Reported; -- = Not Applicable; NA = Not Available; W = Withheld to avoid disclosure of individual company data. |
| Release Date: 6/1/2022 |
| Next Release Date: TBD |