|
Download Data (XLS File) |
|
||||||||
|
||||||||
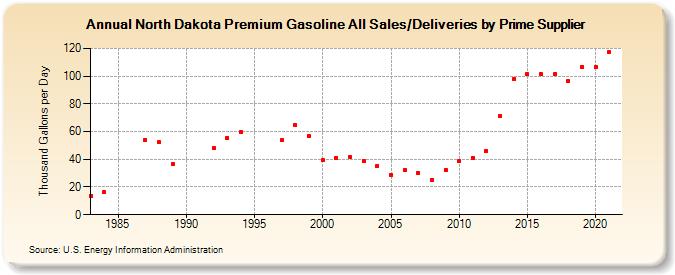
| North Dakota Premium Gasoline All Sales/Deliveries by Prime Supplier (Thousand Gallons per Day) | ||||||||
| Decade | Year-0 | Year-1 | Year-2 | Year-3 | Year-4 | Year-5 | Year-6 | Year-7 | Year-8 | Year-9 |
|---|---|---|---|---|---|---|---|---|---|---|
| 1980's | 13.7 | 16.3 | W | W | 54.1 | 52.2 | 36.7 | |||
| 1990's | W | W | 48.0 | 55.7 | 60.0 | W | W | 53.9 | 64.7 | 56.6 |
| 2000's | 39.4 | 41.0 | 41.8 | 38.8 | 35.1 | 28.9 | 32.2 | 30.1 | 25.2 | 32.6 |
| 2010's | 38.5 | 41.2 | 46.0 | 71.2 | 97.9 | 101.5 | 101.3 | 101.2 | 96.4 | 106.8 |
| 2020's | 106.4 |
| - = No Data Reported; -- = Not Applicable; NA = Not Available; W = Withheld to avoid disclosure of individual company data. |
| Release Date: 6/1/2022 |
| Next Release Date: TBD |