|
Download Data (XLS File) |
|
||||||||
|
||||||||
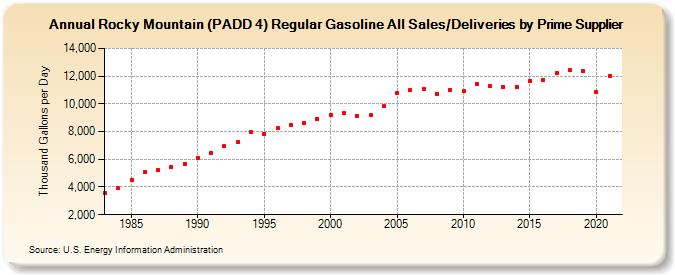
| Rocky Mountain (PADD 4) Regular Gasoline All Sales/Deliveries by Prime Supplier (Thousand Gallons per Day) | ||||||||
| Decade | Year-0 | Year-1 | Year-2 | Year-3 | Year-4 | Year-5 | Year-6 | Year-7 | Year-8 | Year-9 |
|---|---|---|---|---|---|---|---|---|---|---|
| 1980's | 3,537.8 | 3,891.5 | 4,524.6 | 5,058.7 | 5,229.0 | 5,417.7 | 5,653.8 | |||
| 1990's | 6,125.8 | 6,456.5 | 6,927.8 | 7,270.1 | 7,981.1 | 7,845.8 | 8,222.5 | 8,477.4 | 8,583.9 | 8,904.8 |
| 2000's | 9,183.4 | 9,317.9 | 9,094.4 | 9,164.8 | 9,813.8 | 10,805.5 | 10,978.0 | 11,098.8 | 10,736.0 | 10,984.0 |
| 2010's | 10,901.6 | 11,417.4 | 11,269.8 | 11,241.1 | 11,242.4 | 11,652.4 | 11,739.2 | 12,223.5 | 12,454.1 | 12,344.1 |
| 2020's | 10,826.7 |
| - = No Data Reported; -- = Not Applicable; NA = Not Available; W = Withheld to avoid disclosure of individual company data. |
| Release Date: 6/1/2022 |
| Next Release Date: TBD |