|
Download Data (XLS File) |
|
||||||||
|
||||||||
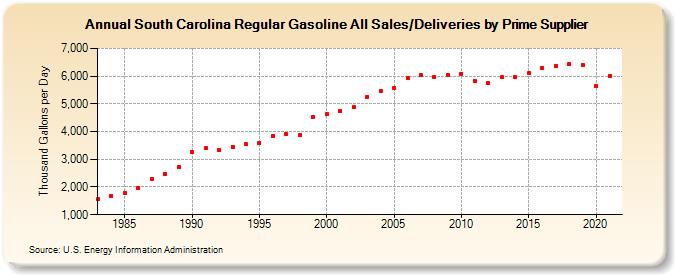
| South Carolina Regular Gasoline All Sales/Deliveries by Prime Supplier (Thousand Gallons per Day) | ||||||||
| Decade | Year-0 | Year-1 | Year-2 | Year-3 | Year-4 | Year-5 | Year-6 | Year-7 | Year-8 | Year-9 |
|---|---|---|---|---|---|---|---|---|---|---|
| 1980's | 1,561.1 | 1,667.4 | 1,801.1 | 1,955.0 | 2,302.9 | 2,472.0 | 2,717.6 | |||
| 1990's | 3,260.0 | 3,393.3 | 3,324.4 | 3,460.1 | 3,535.6 | 3,598.3 | 3,854.0 | 3,894.3 | 3,893.0 | 4,513.1 |
| 2000's | 4,638.2 | 4,758.3 | 4,884.9 | 5,247.5 | 5,478.4 | 5,583.1 | 5,928.4 | 6,025.6 | 5,979.3 | 6,024.7 |
| 2010's | 6,090.2 | 5,816.2 | 5,738.0 | 5,955.7 | 5,971.9 | 6,111.8 | 6,296.1 | 6,362.7 | 6,421.9 | 6,406.5 |
| 2020's | 5,645.8 |
| - = No Data Reported; -- = Not Applicable; NA = Not Available; W = Withheld to avoid disclosure of individual company data. |
| Release Date: 6/1/2022 |
| Next Release Date: TBD |