|
Download Data (XLS File) |
|
||||||||
|
||||||||
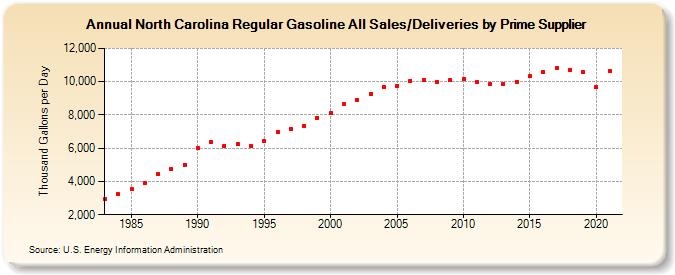
| North Carolina Regular Gasoline All Sales/Deliveries by Prime Supplier (Thousand Gallons per Day) | ||||||||
| Decade | Year-0 | Year-1 | Year-2 | Year-3 | Year-4 | Year-5 | Year-6 | Year-7 | Year-8 | Year-9 |
|---|---|---|---|---|---|---|---|---|---|---|
| 1980's | 2,937.1 | 3,227.0 | 3,522.2 | 3,901.2 | 4,477.0 | 4,755.8 | 5,012.9 | |||
| 1990's | 5,987.3 | 6,370.0 | 6,161.2 | 6,258.8 | 6,131.4 | 6,432.8 | 6,982.9 | 7,179.9 | 7,362.6 | 7,835.5 |
| 2000's | 8,118.0 | 8,664.8 | 8,917.8 | 9,275.1 | 9,704.1 | 9,757.4 | 10,066.1 | 10,087.9 | 9,987.7 | 10,095.1 |
| 2010's | 10,134.7 | 9,974.3 | 9,843.0 | 9,870.1 | 10,008.0 | 10,311.0 | 10,594.1 | 10,794.6 | 10,707.5 | 10,604.5 |
| 2020's | 9,674.4 |
| - = No Data Reported; -- = Not Applicable; NA = Not Available; W = Withheld to avoid disclosure of individual company data. |
| Release Date: 6/1/2022 |
| Next Release Date: TBD |