|
Download Data (XLS File) |
|
||||||||
|
||||||||
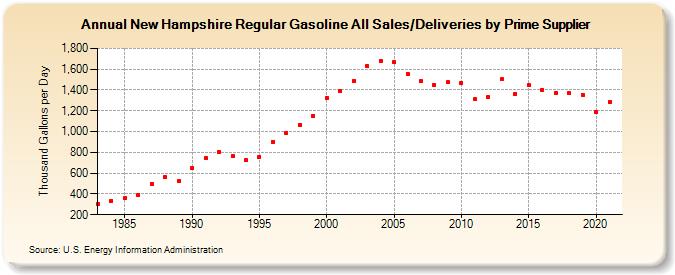
| New Hampshire Regular Gasoline All Sales/Deliveries by Prime Supplier (Thousand Gallons per Day) | ||||||||
| Decade | Year-0 | Year-1 | Year-2 | Year-3 | Year-4 | Year-5 | Year-6 | Year-7 | Year-8 | Year-9 |
|---|---|---|---|---|---|---|---|---|---|---|
| 1980's | 302.5 | 336.4 | 360.3 | 391.3 | 496.1 | 559.7 | 523.6 | |||
| 1990's | 647.4 | 749.4 | 804.8 | 764.3 | 721.9 | 758.2 | 902.8 | 986.5 | 1,065.9 | 1,152.9 |
| 2000's | 1,325.7 | 1,391.4 | 1,490.5 | 1,630.3 | 1,680.1 | 1,666.2 | 1,557.3 | 1,481.8 | 1,449.7 | 1,474.7 |
| 2010's | 1,465.8 | 1,309.9 | 1,331.9 | 1,500.8 | 1,364.2 | 1,443.4 | 1,403.6 | 1,375.2 | 1,370.0 | 1,354.3 |
| 2020's | 1,187.7 |
| - = No Data Reported; -- = Not Applicable; NA = Not Available; W = Withheld to avoid disclosure of individual company data. |
| Release Date: 6/1/2022 |
| Next Release Date: TBD |