|
Download Data (XLS File) |
|
||||||||
|
||||||||
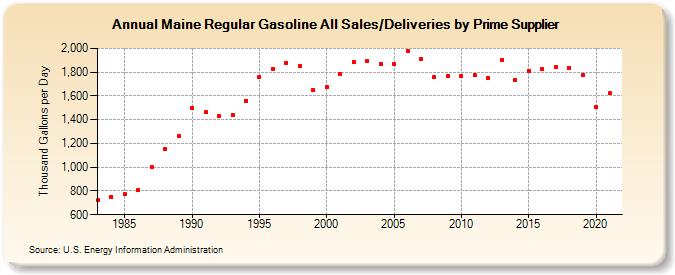
| Maine Regular Gasoline All Sales/Deliveries by Prime Supplier (Thousand Gallons per Day) | ||||||||
| Decade | Year-0 | Year-1 | Year-2 | Year-3 | Year-4 | Year-5 | Year-6 | Year-7 | Year-8 | Year-9 |
|---|---|---|---|---|---|---|---|---|---|---|
| 1980's | 723.5 | 751.7 | 772.5 | 804.8 | 1,000.3 | 1,152.7 | 1,265.7 | |||
| 1990's | 1,501.8 | 1,462.4 | 1,432.5 | 1,443.4 | 1,559.9 | 1,758.8 | 1,823.5 | 1,878.7 | 1,850.8 | 1,653.7 |
| 2000's | 1,678.0 | 1,785.5 | 1,887.1 | 1,889.9 | 1,869.3 | 1,869.4 | 1,976.5 | 1,912.7 | 1,757.0 | 1,763.7 |
| 2010's | 1,770.0 | 1,772.9 | 1,751.7 | 1,902.2 | 1,733.7 | 1,810.6 | 1,823.4 | 1,839.2 | 1,837.4 | 1,773.0 |
| 2020's | 1,506.9 |
| - = No Data Reported; -- = Not Applicable; NA = Not Available; W = Withheld to avoid disclosure of individual company data. |
| Release Date: 6/1/2022 |
| Next Release Date: TBD |