|
Download Data (XLS File) |
|
||||||||
|
||||||||
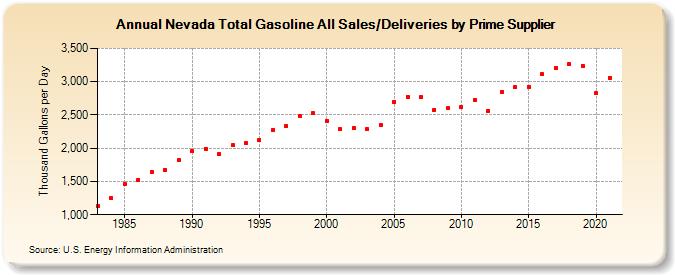
| Nevada Total Gasoline All Sales/Deliveries by Prime Supplier (Thousand Gallons per Day) | ||||||||
| Decade | Year-0 | Year-1 | Year-2 | Year-3 | Year-4 | Year-5 | Year-6 | Year-7 | Year-8 | Year-9 |
|---|---|---|---|---|---|---|---|---|---|---|
| 1980's | 1,132.5 | 1,249.4 | 1,461.9 | 1,518.8 | 1,645.6 | 1,677.8 | 1,815.0 | |||
| 1990's | 1,955.7 | 1,991.8 | 1,907.1 | 2,042.9 | 2,077.3 | 2,123.4 | 2,274.5 | 2,332.4 | 2,477.8 | 2,524.5 |
| 2000's | 2,410.8 | 2,283.2 | 2,305.0 | 2,285.8 | 2,346.9 | 2,701.6 | 2,773.6 | 2,766.7 | 2,579.3 | 2,598.1 |
| 2010's | 2,615.1 | 2,731.4 | 2,562.5 | 2,849.8 | 2,914.8 | 2,926.3 | 3,109.2 | 3,210.4 | 3,263.2 | 3,237.6 |
| 2020's | 2,822.8 |
| - = No Data Reported; -- = Not Applicable; NA = Not Available; W = Withheld to avoid disclosure of individual company data. |
| Release Date: 6/1/2022 |
| Next Release Date: TBD |