|
Download Data (XLS File) |
|
||||||||
|
||||||||
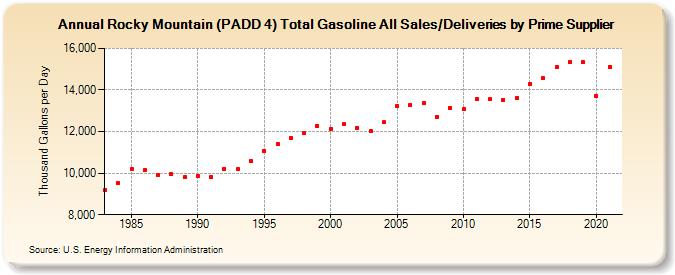
| Rocky Mountain (PADD 4) Total Gasoline All Sales/Deliveries by Prime Supplier (Thousand Gallons per Day) | ||||||||
| Decade | Year-0 | Year-1 | Year-2 | Year-3 | Year-4 | Year-5 | Year-6 | Year-7 | Year-8 | Year-9 |
|---|---|---|---|---|---|---|---|---|---|---|
| 1980's | 9,170.3 | 9,520.1 | 10,179.0 | 10,148.1 | 9,931.2 | 9,960.1 | 9,797.7 | |||
| 1990's | 9,852.3 | 9,814.4 | 10,220.8 | 10,181.8 | 10,591.4 | 11,043.2 | 11,405.3 | 11,692.5 | 11,920.3 | 12,275.2 |
| 2000's | 12,143.4 | 12,345.7 | 12,187.0 | 12,047.8 | 12,444.9 | 13,231.8 | 13,287.3 | 13,362.3 | 12,716.8 | 13,146.1 |
| 2010's | 13,076.3 | 13,568.8 | 13,544.9 | 13,519.8 | 13,614.4 | 14,304.2 | 14,555.2 | 15,121.9 | 15,356.3 | 15,321.9 |
| 2020's | 13,721.7 |
| - = No Data Reported; -- = Not Applicable; NA = Not Available; W = Withheld to avoid disclosure of individual company data. |
| Release Date: 6/1/2022 |
| Next Release Date: TBD |