|
Download Data (XLS File) |
|
||||||||
|
||||||||
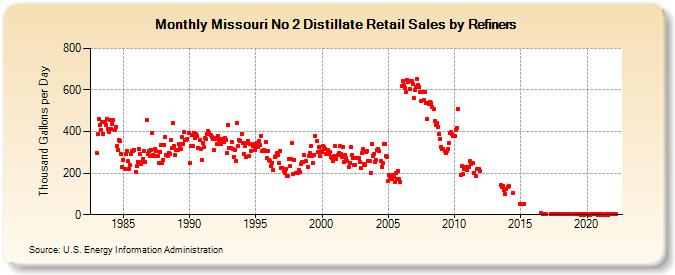
| Missouri No 2 Distillate Retail Sales by Refiners (Thousand Gallons per Day) | ||||||||
| Year | Jan | Feb | Mar | Apr | May | Jun | Jul | Aug | Sep | Oct | Nov | Dec |
|---|---|---|---|---|---|---|---|---|---|---|---|---|
| 1983 | 295.2 | 387.9 | 460.9 | 429.9 | 409.8 | 443.9 | 389.6 | 447.9 | 433.9 | 460.8 | 411.9 | 397.6 |
| 1984 | 454.9 | 414.4 | 437.0 | 454.6 | 406.9 | 423.9 | 332.4 | 311.6 | 359.6 | 356.3 | 292.3 | 229.0 |
| 1985 | 265.1 | 220.1 | 290.6 | 306.3 | 256.4 | 222.1 | 239.2 | 294.0 | 308.3 | 308.4 | 311.2 | 207.1 |
| 1986 | 234.0 | 255.1 | 316.5 | 292.7 | 244.9 | 253.3 | 270.2 | 306.1 | 252.0 | 453.9 | 292.7 | 304.3 |
| 1987 | 280.5 | 313.4 | 391.9 | 288.6 | 284.3 | 316.2 | 304.8 | 282.2 | 246.7 | 303.3 | 336.7 | 250.1 |
| 1988 | 262.6 | 335.2 | 374.3 | 285.7 | 280.6 | 299.2 | 290.2 | 357.2 | 320.1 | 443.2 | 331.7 | 286.8 |
| 1989 | 309.0 | 309.3 | 342.4 | 322.7 | 314.5 | 371.9 | 339.5 | 397.6 | 361.2 | 358.2 | 364.0 | 394.7 |
| 1990 | 248.5 | 330.9 | 383.0 | 329.8 | 391.9 | 369.3 | 386.4 | 380.5 | 320.9 | 360.3 | 317.5 | 265.2 |
| 1991 | 346.1 | 324.1 | 367.6 | 365.3 | 387.8 | 403.3 | 393.5 | 381.1 | 372.3 | 364.7 | 312.9 | 363.8 |
| 1992 | 370.3 | 339.6 | 380.8 | 360.6 | 338.6 | 363.8 | 357.4 | 351.8 | 367.1 | 360.0 | 296.6 | 430.8 |
| 1993 | 322.7 | 321.7 | 351.5 | 315.9 | 279.4 | 313.0 | 259.9 | 442.1 | 332.1 | 361.7 | 356.4 | 387.8 |
| 1994 | 347.1 | 291.5 | 332.8 | 277.9 | 343.7 | 353.8 | 283.5 | 339.7 | 308.4 | 331.3 | 340.2 | 311.4 |
| 1995 | 332.0 | 344.4 | 326.9 | 355.4 | 333.0 | 380.4 | 306.5 | 312.4 | 305.5 | 349.0 | 270.9 | 304.1 |
| 1996 | 264.0 | 257.4 | 233.8 | 250.7 | 215.2 | 276.9 | 280.3 | 296.6 | 289.5 | 248.4 | 308.0 | 223.5 |
| 1997 | 227.0 | 211.4 | 202.2 | 220.4 | 188.5 | 185.0 | 269.1 | 233.4 | 270.3 | 342.8 | 197.1 | 265.1 |
| 1998 | 199.2 | 202.3 | 200.8 | 215.7 | 204.3 | 244.1 | 252.1 | 251.9 | 285.6 | 258.3 | NA | 230.6 |
| 1999 | 284.0 | 296.4 | 330.2 | 284.3 | 250.1 | 289.4 | 380.5 | 354.8 | 302.0 | 323.7 | 284.5 | 305.8 |
| 2000 | 299.4 | 330.7 | 323.9 | 317.8 | 290.0 | 313.4 | 293.7 | 300.2 | 275.7 | 272.0 | 258.1 | 281.6 |
| 2001 | 330.4 | 268.9 | 285.4 | 295.1 | 330.9 | 291.5 | 280.0 | 325.9 | 254.8 | 285.8 | 272.9 | 258.0 |
| 2002 | 227.4 | 248.3 | 325.1 | 286.1 | 272.5 | 237.3 | 237.7 | 271.4 | 274.3 | 273.8 | 254.9 | 225.3 |
| 2003 | 294.5 | 315.3 | 242.5 | 237.4 | 300.2 | 307.6 | 260.4 | 256.7 | 198.3 | 341.2 | 283.5 | 294.4 |
| 2004 | 255.0 | 265.1 | 312.9 | 314.2 | 305.7 | 260.5 | 231.3 | 247.2 | 341.4 | 341.3 | 283.8 | 276.8 |
| 2005 | 161.7 | 191.0 | 182.8 | 169.5 | 192.1 | 179.9 | 157.5 | 198.6 | 173.0 | 210.5 | 170.9 | 157.2 |
| 2006 | 618.8 | 645.4 | 623.1 | 609.5 | 588.8 | 649.0 | 639.0 | 642.9 | 602.8 | 642.4 | 629.3 | 561.1 |
| 2007 | 598.5 | 612.8 | 652.0 | 623.2 | 615.8 | 590.6 | 547.0 | 589.3 | 550.5 | 588.2 | 537.8 | 462.0 |
| 2008 | 536.5 | 531.4 | 542.0 | 539.0 | 519.1 | 510.1 | 450.5 | 430.7 | 442.7 | 423.4 | 390.2 | 365.1 |
| 2009 | 328.1 | 315.3 | 318.0 | 308.6 | 299.2 | 308.7 | 314.9 | 344.9 | 393.0 | 396.5 | 389.1 | 378.9 |
| 2010 | 378.1 | 406.0 | 416.1 | 510.0 | NA | NA | 191.0 | 232.5 | 196.6 | 219.8 | 231.9 | 217.3 |
| 2011 | 229.8 | 228.3 | 256.0 | 246.1 | 247.0 | 247.1 | 202.2 | 184.2 | 220.4 | W | 218.9 | 208.2 |
| 2012 | W | W | W | W | W | W | W | W | W | W | W | W |
| 2013 | W | W | W | W | W | W | 141.3 | 132.9 | 138.1 | 118.9 | 99.2 | 124.2 |
| 2014 | 134.9 | 138.6 | W | W | W | 105.2 | W | W | W | W | W | 50.5 |
| 2015 | W | W | W | 50.5 | W | W | W | W | W | W | W | W |
| 2016 | W | W | W | W | W | W | 6.8 | W | 4.2 | W | W | 1.5 |
| 2017 | W | W | W | 3.3 | W | 2.9 | W | W | 1.7 | W | W | 2.0 |
| 2018 | W | 1.9 | W | W | 5.5 | W | 4.2 | 2.1 | W | 2.8 | W | W |
| 2019 | 1.9 | 1.3 | 2.6 | W | 1.7 | W | 1.5 | 1.0 | 1.5 | 1.0 | 1.3 | W |
| 2020 | 1.1 | W | W | 1.0 | 1.1 | 1.2 | 1.1 | 1.3 | 1.4 | 1.3 | 0.6 | 1.3 |
| 2021 | 1.1 | 0.7 | 1.5 | 0.9 | 0.9 | 1.1 | 0.9 | 1.0 | 1.5 | 1.4 | 1.7 | 1.3 |
| 2022 | NA | 1.6 | 1.9 | |||||||||
| - = No Data Reported; -- = Not Applicable; NA = Not Available; W = Withheld to avoid disclosure of individual company data. |
| Release Date: 6/1/2022 |
| Next Release Date: TBD |