|
Download Data (XLS File) |
|
||||||||
|
||||||||
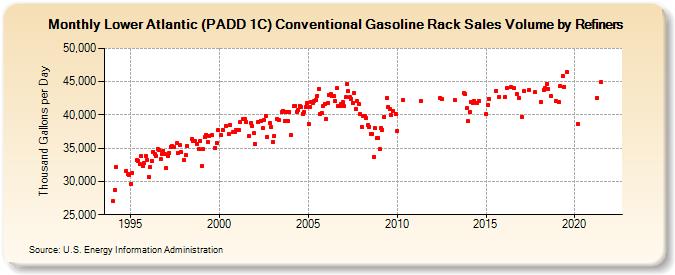
| Lower Atlantic (PADD 1C) Conventional Gasoline Rack Sales Volume by Refiners (Thousand Gallons per Day) | ||||||||
| Year | Jan | Feb | Mar | Apr | May | Jun | Jul | Aug | Sep | Oct | Nov | Dec |
|---|---|---|---|---|---|---|---|---|---|---|---|---|
| 1994 | 27,007.2 | 28,695.8 | 32,098.4 | W | W | W | W | W | W | 31,537.9 | 31,189.3 | 31,035.8 |
| 1995 | 29,557.1 | 31,330.9 | W | W | 33,176.1 | 33,106.9 | 32,548.8 | 33,763.2 | 32,297.4 | 32,782.3 | 33,828.5 | 33,261.9 |
| 1996 | 30,655.9 | 32,188.9 | 33,112.5 | 34,487.5 | 34,119.9 | 33,803.8 | 34,880.3 | 34,793.5 | 33,336.5 | 34,177.8 | 34,645.8 | 34,136.0 |
| 1997 | 31,999.2 | 33,774.4 | 34,338.1 | 35,216.6 | 35,373.2 | 35,205.1 | W | 35,726.9 | 34,289.6 | 35,487.0 | 34,356.4 | W |
| 1998 | 33,212.8 | 33,903.0 | 35,301.5 | W | W | 36,320.8 | 36,129.7 | 36,076.5 | W | 35,573.4 | 34,815.7 | 36,090.6 |
| 1999 | 32,334.8 | 34,863.1 | 36,645.6 | 37,046.6 | 35,982.0 | 36,866.4 | W | 36,954.5 | W | 35,074.3 | 35,808.1 | 37,694.5 |
| 2000 | W | 36,920.3 | 37,719.9 | W | 38,368.0 | W | 37,136.2 | 38,533.5 | W | 37,378.0 | 37,402.3 | 37,704.5 |
| 2001 | W | 37,733.5 | 38,894.5 | W | 39,320.7 | 39,455.5 | 38,913.7 | W | 36,841.7 | 38,789.0 | 38,291.1 | 37,217.9 |
| 2002 | 35,645.8 | W | 38,875.9 | W | 39,017.9 | 38,026.6 | 39,238.3 | 39,837.6 | 36,754.7 | W | 38,753.0 | 38,202.2 |
| 2003 | 36,003.1 | 36,900.6 | W | 39,420.3 | 39,286.9 | W | 40,390.3 | 40,626.8 | 39,143.9 | 40,488.4 | 39,143.8 | 40,462.9 |
| 2004 | 36,947.5 | W | 41,292.2 | 41,401.8 | 40,480.0 | 40,681.5 | 41,362.5 | 41,200.2 | 40,150.4 | 40,492.5 | 41,119.1 | 41,812.7 |
| 2005 | 38,640.0 | 41,218.0 | 41,996.8 | 41,844.8 | 42,078.9 | 42,266.6 | 42,887.5 | 43,954.0 | 40,198.8 | 40,361.9 | 41,374.9 | 41,658.9 |
| 2006 | 39,420.7 | 41,718.0 | 43,057.6 | 43,149.4 | 42,791.8 | 42,783.4 | 42,037.8 | 43,987.6 | 41,392.4 | 41,301.3 | 41,575.1 | 41,881.9 |
| 2007 | 41,300.2 | 42,648.9 | 44,629.7 | 43,544.9 | 42,650.6 | 42,456.5 | 41,857.6 | 43,307.5 | 40,953.8 | 42,023.3 | 41,582.1 | 40,138.5 |
| 2008 | 38,249.3 | 39,882.9 | 39,801.1 | 39,514.0 | 38,478.5 | 38,245.1 | 37,166.0 | 37,151.5 | 33,718.3 | 37,978.7 | 36,526.5 | 36,534.6 |
| 2009 | 34,848.9 | 37,961.6 | 37,784.3 | 39,741.4 | W | 42,510.4 | 41,253.8 | 40,857.0 | 39,940.1 | 40,582.5 | W | 40,200.1 |
| 2010 | 37,560.9 | W | W | NA | 42,280.7 | W | W | W | W | W | W | W |
| 2011 | W | W | W | NA | 42,057.3 | W | W | W | W | W | W | W |
| 2012 | W | W | W | W | W | 42,567.2 | 42,319.3 | W | W | W | W | W |
| 2013 | W | W | W | 42,196.0 | W | W | W | W | W | 43,279.9 | 43,118.6 | 40,986.8 |
| 2014 | 39,016.2 | 40,422.5 | 42,007.8 | 41,740.5 | 42,136.7 | W | 41,752.9 | 42,094.4 | W | W | W | W |
| 2015 | 40,104.2 | 41,515.2 | 42,457.4 | W | W | W | W | 43,666.6 | W | 42,741.0 | W | W |
| 2016 | W | 42,720.4 | 44,021.1 | W | W | 44,168.0 | W | 44,029.7 | W | 43,141.4 | 42,561.9 | W |
| 2017 | 39,735.7 | W | 43,540.1 | W | W | 43,677.0 | W | W | W | 43,377.6 | W | W |
| 2018 | W | 41,866.9 | W | 43,712.5 | 44,017.2 | 44,659.1 | 43,953.5 | W | 42,797.6 | W | W | 42,078.5 |
| 2019 | W | 41,910.7 | 44,349.1 | W | 45,814.0 | 44,239.1 | W | 46,473.4 | W | W | W | W |
| 2020 | W | W | 38,666.6 | W | W | W | W | W | W | W | W | W |
| 2021 | W | W | W | 42,588.3 | W | W | 44,904.3 | W | W | W | W | W |
| 2022 | W | W | W | |||||||||
| - = No Data Reported; -- = Not Applicable; NA = Not Available; W = Withheld to avoid disclosure of individual company data. |
| Release Date: 6/1/2022 |
| Next Release Date: TBD |