|
Download Data (XLS File) |
|
||||||||
|
||||||||
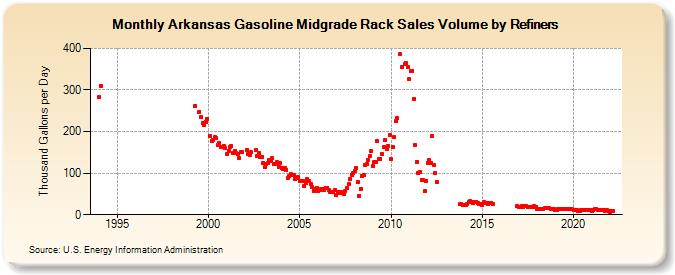
| Arkansas Gasoline Midgrade Rack Sales Volume by Refiners (Thousand Gallons per Day) | ||||||||
| Year | Jan | Feb | Mar | Apr | May | Jun | Jul | Aug | Sep | Oct | Nov | Dec |
|---|---|---|---|---|---|---|---|---|---|---|---|---|
| 1994 | 282.5 | 310.7 | W | W | W | W | W | W | W | W | W | W |
| 1995 | W | W | W | W | W | W | W | W | W | W | W | W |
| 1996 | W | W | W | W | W | W | W | W | W | W | W | W |
| 1997 | W | W | W | W | W | W | W | W | W | W | W | W |
| 1998 | W | W | W | W | W | W | W | W | W | W | W | W |
| 1999 | W | W | W | 261.6 | W | W | 248.0 | 235.3 | 221.6 | 216.2 | 224.1 | 230.7 |
| 2000 | W | 189.3 | 176.8 | 179.2 | 185.8 | 183.9 | 167.9 | 171.6 | 162.6 | 162.6 | 165.3 | 160.2 |
| 2001 | 145.0 | 153.5 | 163.3 | 164.9 | 147.3 | 153.0 | 149.0 | 146.9 | 135.7 | 150.8 | 150.3 | W |
| 2002 | W | 155.9 | 145.7 | 143.6 | 149.8 | W | W | 156.6 | 141.1 | 147.4 | 139.9 | 139.5 |
| 2003 | 125.0 | 113.6 | 120.9 | 123.5 | 132.2 | 129.6 | 135.5 | 121.2 | 120.9 | 125.6 | 115.9 | 123.4 |
| 2004 | 111.4 | 110.4 | 112.9 | 108.4 | 89.3 | 92.4 | 97.5 | 95.1 | 95.2 | 86.2 | 88.3 | 90.5 |
| 2005 | 81.1 | 80.3 | 80.1 | 69.8 | 77.4 | 84.7 | 80.4 | 73.6 | 66.1 | 58.1 | 60.9 | 64.5 |
| 2006 | 57.1 | 59.9 | 60.7 | 61.7 | 60.6 | 64.0 | 65.4 | 60.1 | 53.6 | 54.8 | 55.6 | 58.6 |
| 2007 | 47.8 | 54.7 | 53.1 | 55.0 | 52.3 | 48.9 | 57.2 | 63.5 | 72.7 | 87.0 | 95.7 | 99.4 |
| 2008 | 104.2 | 112.3 | 78.8 | 45.3 | 62.5 | 94.2 | 96.0 | 120.6 | 121.7 | 132.1 | 140.5 | 152.3 |
| 2009 | 116.4 | 126.1 | 126.4 | 177.8 | 134.1 | 133.7 | 147.0 | 161.9 | 180.1 | 159.2 | 166.0 | 191.0 |
| 2010 | 134.0 | 162.0 | 186.0 | 225.8 | 232.2 | NA | 385.6 | 355.6 | NA | 361.9 | 363.7 | 354.8 |
| 2011 | 325.3 | 344.7 | 345.7 | 279.0 | 167.5 | 127.5 | 99.3 | 103.0 | 83.8 | 83.2 | 55.9 | 81.5 |
| 2012 | 125.5 | 132.1 | 125.4 | 190.5 | 119.9 | 99.2 | 78.6 | W | W | W | W | W |
| 2013 | W | W | W | W | W | W | W | W | W | 25.1 | 25.7 | 24.4 |
| 2014 | 24.0 | 23.3 | 26.3 | 29.8 | 32.3 | 31.2 | 29.2 | 29.5 | 31.2 | 28.6 | 26.0 | 26.3 |
| 2015 | 24.2 | 29.9 | 27.4 | 27.4 | 26.5 | 29.0 | 28.2 | 25.7 | W | W | W | W |
| 2016 | W | W | W | W | W | W | W | W | W | W | W | 21.6 |
| 2017 | 17.9 | 19.6 | 20.4 | 19.7 | 19.8 | 19.9 | 19.6 | 19.6 | 18.3 | 18.6 | 20.2 | 19.2 |
| 2018 | 14.4 | 14.1 | 14.9 | 14.3 | 14.3 | 15.2 | 16.2 | 15.5 | 15.5 | 14.1 | 14.8 | 12.6 |
| 2019 | 11.7 | 11.7 | 14.1 | 13.1 | 13.4 | 13.7 | 14.4 | 13.5 | 13.2 | 14.0 | 13.4 | 12.8 |
| 2020 | 11.5 | 11.5 | 10.3 | 9.1 | 8.5 | 11.1 | 10.9 | 11.4 | 12.1 | 12.2 | 11.9 | 11.3 |
| 2021 | 9.5 | 10.9 | 13.8 | 13.9 | 11.5 | 11.8 | 11.8 | 12.1 | 10.2 | 9.4 | 10.7 | 9.6 |
| 2022 | 7.3 | 8.4 | 8.5 | |||||||||
| - = No Data Reported; -- = Not Applicable; NA = Not Available; W = Withheld to avoid disclosure of individual company data. |
| Release Date: 6/1/2022 |
| Next Release Date: TBD |