|
Download Data (XLS File) |
|
||||||||
|
||||||||
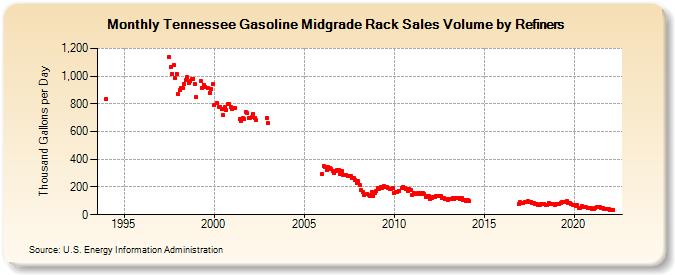
| Tennessee Gasoline Midgrade Rack Sales Volume by Refiners (Thousand Gallons per Day) | ||||||||
| Year | Jan | Feb | Mar | Apr | May | Jun | Jul | Aug | Sep | Oct | Nov | Dec |
|---|---|---|---|---|---|---|---|---|---|---|---|---|
| 1994 | 833.6 | W | W | W | W | W | W | W | W | W | W | W |
| 1995 | W | W | W | W | W | W | W | W | W | W | W | W |
| 1996 | W | W | W | W | W | W | W | W | W | W | W | W |
| 1997 | W | W | W | W | W | W | 1,139.9 | 1,066.3 | 1,018.1 | 1,077.6 | 983.4 | 1,018.6 |
| 1998 | 872.1 | 900.4 | 916.0 | 913.4 | 944.9 | 968.7 | 991.7 | 951.9 | 961.2 | 978.0 | 978.8 | 941.9 |
| 1999 | 848.1 | W | W | 966.4 | 917.1 | 938.4 | 924.2 | W | 916.3 | 880.8 | 905.0 | 940.3 |
| 2000 | 791.1 | W | 805.5 | 779.2 | 780.0 | 766.1 | 718.7 | 776.1 | 755.7 | 798.1 | 797.2 | 774.7 |
| 2001 | 762.9 | 769.5 | 771.6 | W | W | 689.1 | 679.0 | 695.7 | 687.2 | 741.2 | 731.5 | 697.2 |
| 2002 | 701.3 | 706.1 | 727.9 | 700.2 | 682.8 | W | W | W | W | W | W | 696.3 |
| 2003 | 661.4 | W | W | W | W | W | W | W | W | W | W | W |
| 2004 | W | W | W | W | W | W | W | W | W | W | W | W |
| 2005 | W | W | W | W | W | W | W | W | W | W | W | W |
| 2006 | 292.1 | 351.1 | 341.2 | 322.6 | 341.0 | 339.3 | 327.2 | 317.3 | 297.7 | 313.4 | 320.0 | 322.0 |
| 2007 | 294.4 | 311.8 | 288.3 | 284.6 | 287.0 | 278.2 | 275.9 | 281.7 | 268.3 | 262.1 | 252.4 | 230.3 |
| 2008 | 240.3 | 216.2 | 176.9 | 164.6 | 141.3 | W | 152.5 | 144.8 | 137.6 | 166.9 | 133.0 | 157.0 |
| 2009 | 173.8 | 190.3 | 186.0 | 200.1 | 192.9 | 206.3 | 202.3 | 198.7 | 189.9 | 183.8 | 186.9 | 191.6 |
| 2010 | 156.3 | 166.3 | 165.9 | 173.7 | W | 193.2 | 202.2 | 191.7 | 182.8 | 172.5 | 185.7 | 181.1 |
| 2011 | 144.2 | 159.7 | 149.6 | 150.0 | 159.6 | 159.4 | 152.0 | 154.6 | 147.2 | 131.4 | 135.0 | 134.4 |
| 2012 | 115.5 | 121.6 | 129.8 | 127.8 | 137.0 | 137.9 | 132.5 | 132.1 | 119.4 | 122.4 | 116.0 | 110.5 |
| 2013 | 103.3 | 110.3 | 112.9 | 119.3 | 115.2 | 120.0 | 117.0 | 121.3 | 113.0 | 117.2 | 108.1 | 108.0 |
| 2014 | 98.2 | 104.3 | 98.7 | W | W | W | W | W | W | W | W | W |
| 2015 | W | W | W | W | W | W | W | W | W | W | W | W |
| 2016 | W | W | W | W | W | W | W | W | W | W | W | 77.8 |
| 2017 | 88.3 | 84.8 | 83.7 | 90.0 | 94.8 | 97.7 | 90.9 | 92.5 | 86.1 | 81.1 | 80.8 | 75.0 |
| 2018 | 67.8 | 67.9 | 74.6 | 78.0 | 79.9 | 69.4 | 71.0 | 87.8 | 77.2 | 80.7 | 79.7 | 71.7 |
| 2019 | 74.7 | 74.1 | 77.8 | 86.8 | 95.3 | 90.7 | 88.4 | 97.3 | 82.9 | 81.4 | 74.7 | 68.5 |
| 2020 | 68.4 | 65.7 | 68.3 | 50.4 | 46.6 | 60.3 | 56.5 | 53.8 | 53.5 | 47.8 | 47.6 | 44.9 |
| 2021 | 43.3 | 39.4 | 45.5 | 53.8 | 58.1 | 53.9 | 51.5 | 50.7 | 42.4 | 39.6 | 40.0 | 39.3 |
| 2022 | 33.0 | 34.3 | 34.2 | |||||||||
| - = No Data Reported; -- = Not Applicable; NA = Not Available; W = Withheld to avoid disclosure of individual company data. |
| Release Date: 6/1/2022 |
| Next Release Date: TBD |