|
Download Data (XLS File) |
|
||||||||
|
||||||||
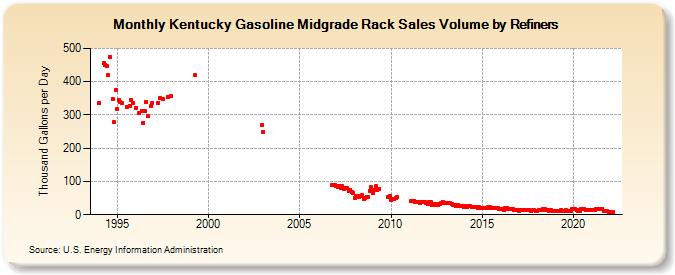
| Kentucky Gasoline Midgrade Rack Sales Volume by Refiners (Thousand Gallons per Day) | ||||||||
| Year | Jan | Feb | Mar | Apr | May | Jun | Jul | Aug | Sep | Oct | Nov | Dec |
|---|---|---|---|---|---|---|---|---|---|---|---|---|
| 1994 | 335.5 | W | W | 454.6 | 451.4 | 447.1 | 419.5 | 474.9 | W | 346.8 | 277.7 | 376.1 |
| 1995 | 318.4 | 343.6 | 338.8 | 337.0 | W | W | 324.6 | W | 327.6 | 346.0 | 337.1 | W |
| 1996 | 321.3 | W | 304.7 | W | 312.6 | 277.0 | 310.7 | 338.9 | 296.4 | W | 327.1 | 336.3 |
| 1997 | W | W | W | 336.8 | 350.1 | W | 346.6 | W | W | 354.5 | W | 356.1 |
| 1998 | W | W | W | W | W | W | W | W | W | W | W | W |
| 1999 | W | W | W | 418.9 | W | W | W | W | W | W | W | W |
| 2000 | W | W | W | W | W | W | W | W | W | W | W | W |
| 2001 | W | W | W | W | W | W | W | W | W | W | W | W |
| 2002 | W | W | W | W | W | W | W | W | W | W | W | 269.5 |
| 2003 | 248.6 | W | W | W | W | W | W | W | W | W | W | W |
| 2004 | W | W | W | W | W | W | W | W | W | W | W | W |
| 2005 | W | W | W | W | W | W | W | W | W | W | W | W |
| 2006 | W | W | W | W | W | W | W | W | W | 89.6 | 90.1 | 90.4 |
| 2007 | 85.1 | 82.0 | 87.5 | 81.5 | 85.4 | 77.8 | 81.0 | 79.3 | 71.4 | 75.4 | 69.6 | 65.0 |
| 2008 | 51.6 | 56.6 | 57.6 | 54.6 | 55.1 | 57.9 | 47.9 | 49.3 | 53.1 | 52.4 | 71.3 | 83.3 |
| 2009 | 64.9 | 75.7 | 86.3 | 75.3 | 77.9 | W | W | W | W | W | 53.9 | 54.9 |
| 2010 | 43.5 | 46.8 | 48.1 | 49.1 | 52.1 | W | W | W | W | W | W | W |
| 2011 | W | 40.5 | 41.6 | 42.6 | 37.2 | 37.6 | 38.7 | 34.1 | 38.3 | 38.4 | 38.0 | 34.5 |
| 2012 | 32.4 | 38.7 | 38.5 | 29.3 | 31.6 | 30.6 | 31.5 | 28.7 | 31.0 | 33.8 | 39.6 | 35.6 |
| 2013 | 36.7 | 34.5 | 36.3 | 35.3 | 32.0 | 30.3 | 28.5 | 25.5 | 28.1 | 26.3 | 27.1 | 25.4 |
| 2014 | 24.3 | 25.7 | 23.7 | 25.4 | 24.7 | 22.8 | 23.6 | 22.9 | 23.5 | 21.4 | 22.8 | 21.1 |
| 2015 | 19.9 | 19.0 | 19.8 | 20.1 | 22.6 | 21.9 | 20.5 | 21.4 | 20.7 | 20.2 | 21.1 | 18.3 |
| 2016 | 15.7 | 15.7 | 15.6 | 19.6 | 19.5 | 17.6 | 16.0 | 16.3 | 16.7 | 14.0 | 14.7 | 13.1 |
| 2017 | 12.5 | 13.4 | 14.9 | 13.9 | 14.9 | 15.2 | 14.5 | 14.9 | 12.4 | 13.5 | 13.1 | 12.3 |
| 2018 | 12.6 | 13.0 | 15.0 | 13.6 | 17.7 | 16.1 | 13.0 | 13.9 | 12.2 | 13.1 | 11.9 | 10.9 |
| 2019 | 9.9 | 9.9 | 10.7 | 11.0 | 14.2 | 11.2 | 11.1 | 13.5 | 12.5 | 11.8 | 11.3 | 17.1 |
| 2020 | 15.8 | 17.2 | 13.3 | 10.0 | 12.6 | 17.5 | 17.5 | 17.6 | 15.2 | 14.7 | 14.8 | 15.3 |
| 2021 | 13.1 | 14.5 | 13.7 | 17.6 | 17.8 | 17.9 | 17.5 | 17.6 | 10.6 | 10.1 | 11.0 | 9.6 |
| 2022 | 8.5 | 8.8 | 9.4 | |||||||||
| - = No Data Reported; -- = Not Applicable; NA = Not Available; W = Withheld to avoid disclosure of individual company data. |
| Release Date: 6/1/2022 |
| Next Release Date: TBD |