|
Download Data (XLS File) |
|
||||||||
|
||||||||
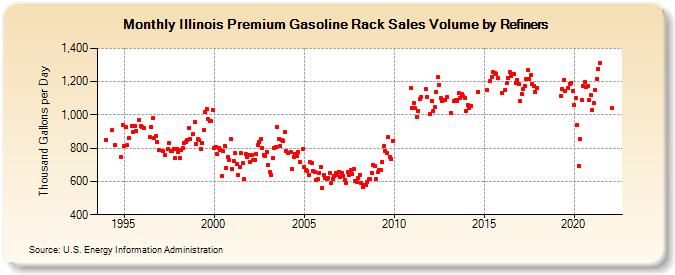
| Illinois Premium Gasoline Rack Sales Volume by Refiners (Thousand Gallons per Day) | ||||||||
| Year | Jan | Feb | Mar | Apr | May | Jun | Jul | Aug | Sep | Oct | Nov | Dec |
|---|---|---|---|---|---|---|---|---|---|---|---|---|
| 1994 | 850.2 | W | W | W | 910.6 | W | 820.8 | W | W | W | 744.8 | 942.2 |
| 1995 | 812.6 | 927.2 | 816.5 | 860.7 | W | 933.6 | 898.4 | 934.6 | 904.4 | W | 969.5 | 935.6 |
| 1996 | 924.4 | 920.4 | W | W | W | 868.3 | 928.9 | 979.6 | 858.3 | 876.1 | 839.3 | 788.2 |
| 1997 | W | W | 784.9 | 757.1 | W | 794.8 | 830.0 | 783.3 | 782.2 | 796.2 | 739.4 | 798.1 |
| 1998 | 774.1 | 742.3 | 791.5 | 798.2 | 832.3 | 839.6 | 850.0 | 922.1 | 857.9 | W | 885.0 | 959.1 |
| 1999 | 826.1 | 855.6 | 846.9 | 796.4 | 829.3 | 908.3 | 1,015.2 | 1,037.0 | 978.0 | 963.6 | 962.5 | 1,030.5 |
| 2000 | 799.9 | 809.1 | 763.8 | 798.3 | 788.2 | 632.7 | 784.1 | 814.9 | 682.0 | 745.0 | 730.2 | 854.7 |
| 2001 | 672.7 | 721.7 | 770.5 | 703.3 | 636.5 | 687.0 | 768.5 | 708.5 | 612.6 | 766.5 | 747.0 | 760.1 |
| 2002 | 716.2 | 756.5 | 726.1 | 728.2 | 764.8 | 821.3 | 834.9 | 853.8 | 801.6 | 762.0 | 750.6 | 778.3 |
| 2003 | 701.7 | 655.2 | 641.5 | 742.8 | 798.5 | 806.4 | 926.5 | 856.5 | 812.4 | 849.0 | 845.5 | 897.7 |
| 2004 | 781.6 | 773.6 | W | 779.4 | 674.1 | 749.6 | 762.4 | 752.0 | 777.1 | 717.4 | W | 797.7 |
| 2005 | 684.7 | 670.8 | 664.6 | 636.2 | 715.6 | 713.8 | 665.1 | 658.2 | 606.3 | 613.1 | 652.2 | 687.5 |
| 2006 | 561.1 | 636.3 | 622.0 | 613.9 | 621.1 | 651.5 | 590.7 | 615.5 | 630.3 | 653.5 | 641.5 | 658.4 |
| 2007 | 625.0 | 648.1 | 635.5 | 608.2 | 590.2 | 655.9 | 638.8 | 667.7 | 643.6 | 676.6 | 605.2 | 595.6 |
| 2008 | 620.3 | 640.0 | 593.2 | 565.2 | 576.3 | 577.6 | 595.2 | 612.0 | 613.9 | 653.2 | 695.9 | 690.1 |
| 2009 | 613.7 | 655.3 | 671.1 | 669.9 | 719.7 | 812.4 | 783.1 | 773.2 | 866.6 | 747.7 | 732.1 | 844.3 |
| 2010 | W | W | W | W | W | W | W | W | W | W | W | 1,163.2 |
| 2011 | 1,040.5 | 1,070.0 | 1,039.6 | 990.1 | 1,026.1 | 1,094.0 | 1,108.5 | W | W | 1,154.4 | 1,109.3 | W |
| 2012 | 1,002.8 | 1,085.9 | 1,021.6 | 1,048.5 | 1,140.1 | 1,226.1 | 1,180.2 | 1,098.8 | 1,081.2 | W | 1,090.5 | 1,104.9 |
| 2013 | W | W | 1,010.6 | W | 1,082.5 | 1,091.7 | 1,084.5 | 1,131.5 | 1,102.0 | 1,124.3 | 1,113.1 | 1,100.7 |
| 2014 | 1,021.1 | 1,062.1 | 1,043.3 | 1,056.5 | W | W | W | W | 1,139.8 | W | W | W |
| 2015 | W | W | 1,151.3 | W | 1,204.4 | 1,225.3 | 1,255.5 | 1,249.7 | 1,247.0 | 1,222.1 | W | W |
| 2016 | 1,134.2 | W | 1,149.7 | 1,192.9 | 1,220.7 | 1,256.6 | 1,233.7 | 1,247.8 | 1,245.2 | 1,194.6 | 1,211.7 | 1,186.4 |
| 2017 | 1,081.4 | 1,128.0 | 1,156.5 | 1,172.8 | 1,214.0 | 1,269.1 | 1,215.2 | 1,237.6 | 1,184.0 | 1,175.3 | 1,138.0 | 1,160.7 |
| 2018 | W | W | W | W | W | W | W | W | W | W | W | W |
| 2019 | W | W | W | 1,116.4 | 1,153.4 | 1,209.2 | 1,146.6 | W | 1,164.1 | 1,188.4 | 1,194.8 | 1,142.7 |
| 2020 | 1,058.3 | 1,102.4 | 937.8 | 695.2 | 855.5 | 1,088.3 | 1,176.5 | 1,199.0 | 1,168.2 | 1,176.4 | 1,092.0 | 1,120.0 |
| 2021 | 1,029.3 | 1,074.2 | 1,152.7 | 1,218.1 | 1,278.6 | 1,310.0 | W | W | W | W | W | W |
| 2022 | W | 1,038.8 | W | |||||||||
| - = No Data Reported; -- = Not Applicable; NA = Not Available; W = Withheld to avoid disclosure of individual company data. |
| Release Date: 6/1/2022 |
| Next Release Date: TBD |