|
Download Data (XLS File) |
|
||||||||
|
||||||||
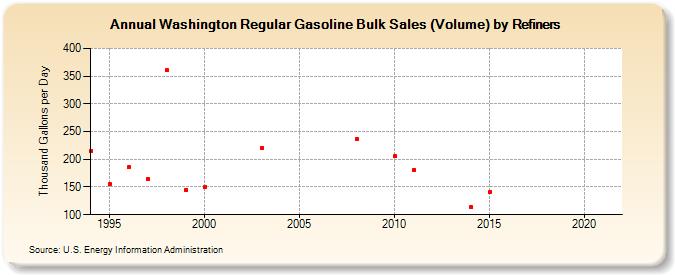
| Washington Regular Gasoline Bulk Sales (Volume) by Refiners (Thousand Gallons per Day) | ||||||||
| Decade | Year-0 | Year-1 | Year-2 | Year-3 | Year-4 | Year-5 | Year-6 | Year-7 | Year-8 | Year-9 |
|---|---|---|---|---|---|---|---|---|---|---|
| 1990's | 215.2 | 155.8 | 185.5 | 164.5 | 360.3 | 145.0 | ||||
| 2000's | 149.4 | W | W | 221.0 | W | W | W | W | 237.2 | W |
| 2010's | 205.2 | 181.3 | W | W | 113.8 | 141.1 | W | W | W | W |
| 2020's | - |
| - = No Data Reported; -- = Not Applicable; NA = Not Available; W = Withheld to avoid disclosure of individual company data. |
| Release Date: 6/1/2022 |
| Next Release Date: TBD |