|
Download Data (XLS File) |
|
||||||||
|
||||||||
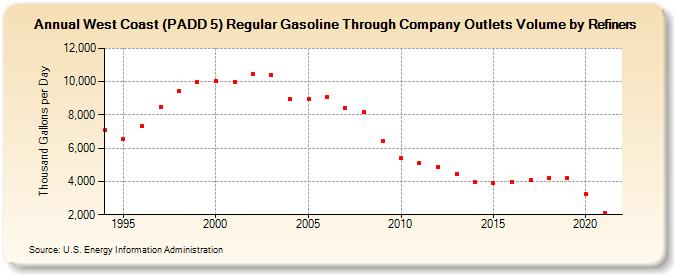
| West Coast (PADD 5) Regular Gasoline Through Company Outlets Volume by Refiners (Thousand Gallons per Day) | ||||||||
| Decade | Year-0 | Year-1 | Year-2 | Year-3 | Year-4 | Year-5 | Year-6 | Year-7 | Year-8 | Year-9 |
|---|---|---|---|---|---|---|---|---|---|---|
| 1990's | 7,074.1 | 6,566.4 | 7,356.2 | 8,498.7 | 9,460.4 | 9,972.1 | ||||
| 2000's | 10,037.9 | 9,988.4 | 10,483.9 | 10,386.4 | 8,935.8 | 8,982.4 | 9,093.5 | 8,428.7 | 8,158.7 | 6,411.3 |
| 2010's | 5,398.3 | 5,105.9 | 4,883.9 | 4,450.0 | 3,947.3 | 3,927.4 | 3,964.1 | 4,069.8 | 4,230.9 | 4,198.2 |
| 2020's | 3,241.2 |
| - = No Data Reported; -- = Not Applicable; NA = Not Available; W = Withheld to avoid disclosure of individual company data. |
| Release Date: 6/1/2022 |
| Next Release Date: TBD |