|
Download Data (XLS File) |
|
||||||||
|
||||||||
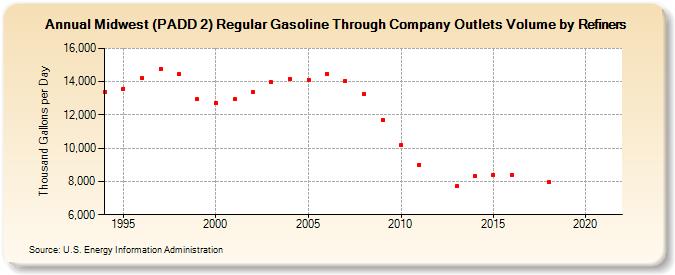
| Midwest (PADD 2) Regular Gasoline Through Company Outlets Volume by Refiners (Thousand Gallons per Day) | ||||||||
| Decade | Year-0 | Year-1 | Year-2 | Year-3 | Year-4 | Year-5 | Year-6 | Year-7 | Year-8 | Year-9 |
|---|---|---|---|---|---|---|---|---|---|---|
| 1990's | 13,401.1 | 13,577.8 | 14,220.0 | 14,782.8 | 14,433.9 | 12,936.4 | ||||
| 2000's | 12,709.4 | 12,939.7 | 13,371.3 | 13,957.9 | 14,171.9 | 14,127.5 | 14,476.5 | 14,029.3 | 13,255.2 | 11,700.3 |
| 2010's | 10,191.4 | 9,006.6 | W | 7,699.8 | 8,302.1 | 8,409.3 | 8,390.3 | W | 7,965.4 | W |
| 2020's | W |
| - = No Data Reported; -- = Not Applicable; NA = Not Available; W = Withheld to avoid disclosure of individual company data. |
| Release Date: 6/1/2022 |
| Next Release Date: TBD |