|
Download Data (XLS File) |
|
||||||||
|
||||||||
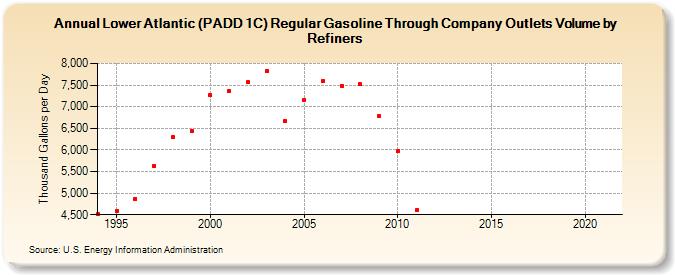
| Lower Atlantic (PADD 1C) Regular Gasoline Through Company Outlets Volume by Refiners (Thousand Gallons per Day) | ||||||||
| Decade | Year-0 | Year-1 | Year-2 | Year-3 | Year-4 | Year-5 | Year-6 | Year-7 | Year-8 | Year-9 |
|---|---|---|---|---|---|---|---|---|---|---|
| 1990's | 4,506.2 | 4,587.4 | 4,872.1 | 5,637.3 | 6,290.2 | 6,448.9 | ||||
| 2000's | 7,268.1 | 7,363.4 | 7,561.7 | 7,820.4 | 6,667.9 | 7,146.5 | 7,594.3 | 7,486.2 | 7,517.0 | 6,773.2 |
| 2010's | 5,965.9 | 4,608.3 | W | W | W | W | W | W | W | W |
| 2020's | W |
| - = No Data Reported; -- = Not Applicable; NA = Not Available; W = Withheld to avoid disclosure of individual company data. |
| Release Date: 6/1/2022 |
| Next Release Date: TBD |