|
Download Data (XLS File) |
|
||||||||
|
||||||||
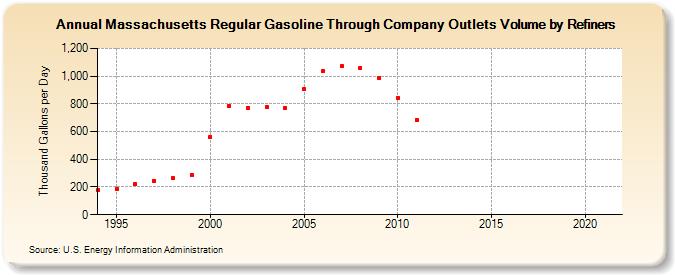
| Massachusetts Regular Gasoline Through Company Outlets Volume by Refiners (Thousand Gallons per Day) | ||||||||
| Decade | Year-0 | Year-1 | Year-2 | Year-3 | Year-4 | Year-5 | Year-6 | Year-7 | Year-8 | Year-9 |
|---|---|---|---|---|---|---|---|---|---|---|
| 1990's | 179.4 | 187.4 | 221.1 | 246.8 | 262.6 | 286.9 | ||||
| 2000's | 563.1 | 786.3 | 772.3 | 780.5 | 772.8 | 904.2 | 1,034.4 | 1,073.2 | 1,058.7 | 986.0 |
| 2010's | 842.5 | 685.5 | W | W | W | W | W | W | W | W |
| 2020's | W |
| - = No Data Reported; -- = Not Applicable; NA = Not Available; W = Withheld to avoid disclosure of individual company data. |
| Release Date: 6/1/2022 |
| Next Release Date: TBD |