|
Download Data (XLS File) |
|
||||||||
|
||||||||
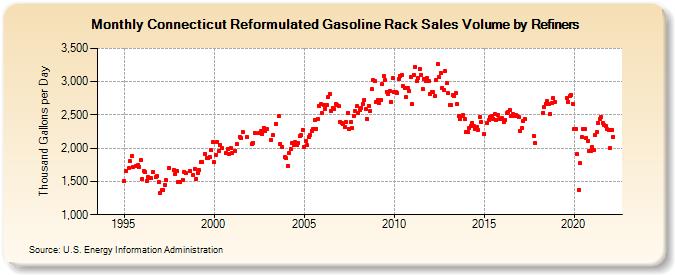
| Connecticut Reformulated Gasoline Rack Sales Volume by Refiners (Thousand Gallons per Day) | ||||||||
| Year | Jan | Feb | Mar | Apr | May | Jun | Jul | Aug | Sep | Oct | Nov | Dec |
|---|---|---|---|---|---|---|---|---|---|---|---|---|
| 1994 | - | - | - | - | - | - | - | - | - | - | W | W |
| 1995 | 1,500.9 | 1,652.1 | W | 1,696.7 | 1,802.5 | 1,879.3 | 1,720.6 | W | 1,724.9 | 1,747.1 | 1,722.8 | 1,827.0 |
| 1996 | 1,533.9 | 1,660.8 | 1,638.1 | 1,506.8 | 1,560.6 | 1,547.1 | 1,548.8 | 1,638.6 | W | 1,562.7 | 1,577.6 | 1,490.6 |
| 1997 | 1,325.8 | 1,372.4 | 1,374.3 | 1,449.7 | 1,515.8 | W | 1,709.0 | W | W | 1,674.8 | 1,608.9 | 1,660.6 |
| 1998 | 1,489.9 | 1,487.9 | W | 1,525.8 | 1,648.2 | 1,629.1 | W | W | 1,660.8 | W | 1,600.8 | 1,688.6 |
| 1999 | 1,538.8 | 1,630.3 | 1,667.3 | 1,789.5 | 1,794.2 | W | 1,917.3 | 1,854.4 | 1,845.4 | 1,874.9 | 1,968.1 | 2,099.1 |
| 2000 | 1,790.9 | 1,899.6 | 2,099.2 | 1,950.5 | 2,053.5 | 1,998.4 | W | W | 1,924.0 | 1,982.6 | 1,918.4 | 1,996.5 |
| 2001 | 1,928.8 | W | 1,961.7 | 2,060.5 | W | 2,173.1 | 2,154.4 | 2,242.1 | W | W | 2,165.5 | W |
| 2002 | W | 2,067.1 | 2,085.4 | 2,234.0 | W | W | 2,232.7 | 2,251.1 | 2,208.0 | 2,306.2 | 2,251.2 | 2,293.8 |
| 2003 | W | W | 2,128.0 | 2,191.9 | W | 2,367.7 | W | 2,476.6 | 2,064.8 | 2,019.7 | W | 1,861.0 |
| 2004 | 1,848.6 | 1,737.9 | 1,926.8 | 1,986.6 | 2,071.1 | 2,046.4 | 2,087.6 | 2,051.2 | 2,085.3 | 2,177.0 | 2,194.0 | 2,277.2 |
| 2005 | 2,017.2 | 2,113.6 | 2,041.1 | 2,168.4 | 2,200.1 | 2,259.7 | 2,291.1 | 2,417.8 | 2,292.4 | 2,442.1 | 2,640.5 | 2,657.0 |
| 2006 | 2,523.0 | 2,645.8 | 2,594.7 | 2,645.5 | 2,762.6 | 2,816.2 | 2,563.2 | 2,606.7 | 2,589.6 | 2,663.7 | 2,643.8 | 2,631.3 |
| 2007 | 2,396.5 | 2,383.6 | 2,356.9 | 2,325.6 | 2,398.8 | 2,532.7 | 2,287.0 | 2,392.5 | 2,306.7 | 2,488.0 | 2,552.0 | 2,629.0 |
| 2008 | 2,527.8 | 2,570.7 | 2,608.7 | 2,668.4 | 2,724.1 | 2,583.5 | 2,442.3 | 2,635.3 | 2,561.4 | 2,886.5 | 3,023.9 | 3,008.4 |
| 2009 | 2,696.1 | 2,730.1 | 2,683.8 | 2,727.1 | 2,958.3 | 3,086.7 | 3,021.6 | 2,848.6 | 2,814.5 | 2,864.5 | 2,694.6 | 3,049.7 |
| 2010 | 2,841.6 | 2,844.6 | 2,828.1 | 3,041.2 | 3,088.2 | 3,101.3 | 2,933.2 | 2,902.0 | 2,769.3 | 2,901.6 | 2,860.7 | 3,069.6 |
| 2011 | 2,660.0 | 3,106.6 | 3,219.9 | 3,008.0 | 3,060.2 | 3,193.0 | 3,102.5 | 2,888.1 | 3,045.5 | 3,005.3 | 3,061.6 | 3,007.2 |
| 2012 | 2,819.1 | 2,843.5 | 2,840.0 | 2,780.5 | 3,018.0 | 3,269.1 | 3,064.7 | 3,128.8 | 2,911.4 | 2,880.8 | 3,161.2 | 2,974.3 |
| 2013 | 2,823.0 | 2,647.6 | 2,645.6 | 2,801.2 | 2,781.8 | 2,825.0 | 2,662.2 | 2,484.4 | 2,433.0 | 2,486.8 | 2,499.5 | 2,440.4 |
| 2014 | 2,248.0 | 2,239.5 | 2,305.6 | 2,336.2 | 2,385.4 | 2,336.4 | 2,283.8 | 2,325.4 | 2,278.0 | 2,464.7 | 2,400.6 | W |
| 2015 | 2,214.6 | W | 2,378.3 | 2,420.0 | 2,473.1 | 2,481.8 | 2,445.1 | 2,513.2 | 2,421.1 | 2,504.2 | 2,431.7 | 2,445.8 |
| 2016 | 2,451.2 | 2,394.4 | 2,425.1 | 2,523.3 | 2,543.9 | 2,579.6 | 2,490.6 | 2,513.8 | 2,483.1 | 2,505.2 | 2,489.8 | 2,475.8 |
| 2017 | 2,253.3 | 2,302.5 | 2,403.6 | 2,438.4 | W | W | W | W | W | 2,187.1 | 2,080.4 | W |
| 2018 | W | W | W | 2,534.8 | 2,623.5 | 2,668.4 | 2,705.4 | 2,667.6 | 2,515.6 | 2,675.5 | 2,752.4 | 2,698.5 |
| 2019 | W | W | W | W | W | W | W | 2,756.1 | 2,695.3 | 2,785.0 | 2,805.6 | 2,670.9 |
| 2020 | 2,287.5 | 2,290.2 | 1,907.3 | 1,377.3 | 1,772.4 | 2,169.8 | 2,288.4 | 2,290.3 | 2,153.8 | 2,114.3 | 1,963.0 | 1,961.5 |
| 2021 | 2,016.5 | 1,977.4 | 2,196.9 | 2,246.8 | 2,380.6 | 2,439.7 | 2,475.0 | 2,378.9 | 2,342.8 | 2,333.6 | 2,282.9 | 2,268.8 |
| 2022 | 1,998.6 | 2,279.1 | 2,175.6 | |||||||||
| - = No Data Reported; -- = Not Applicable; NA = Not Available; W = Withheld to avoid disclosure of individual company data. |
| Release Date: 6/1/2022 |
| Next Release Date: TBD |