|
Download Data (XLS File) |
|
|||||
|
|||||
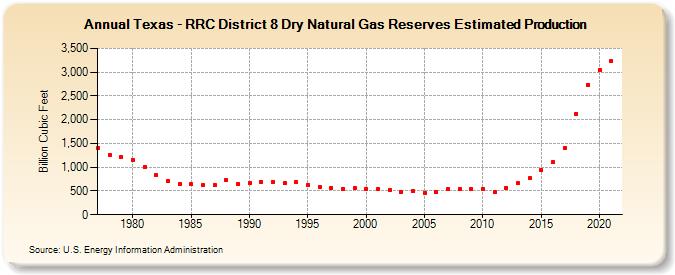
| Texas - RRC District 8 Dry Natural Gas Reserves Estimated Production (Billion Cubic Feet) | |||||
| Decade | Year-0 | Year-1 | Year-2 | Year-3 | Year-4 | Year-5 | Year-6 | Year-7 | Year-8 | Year-9 |
|---|---|---|---|---|---|---|---|---|---|---|
| 1970's | 1,401 | 1,265 | 1,214 | |||||||
| 1980's | 1,159 | 1,008 | 832 | 713 | 643 | 646 | 619 | 633 | 734 | 654 |
| 1990's | 663 | 691 | 693 | 660 | 688 | 631 | 583 | 572 | 541 | 559 |
| 2000's | 547 | 533 | 524 | 484 | 493 | 464 | 480 | 538 | 541 | 545 |
| 2010's | 549 | 470 | 564 | 662 | 767 | 948 | 1,107 | 1,404 | 2,129 | 2,736 |
| 2020's | 3,049 | 3,231 |
| - = No Data Reported; -- = Not Applicable; NA = Not Available; W = Withheld to avoid disclosure of individual company data. |
| Release Date: 12/30/2022 |
| Next Release Date: NA |