|
Download Data (XLS File) |
|
|||||
|
|||||
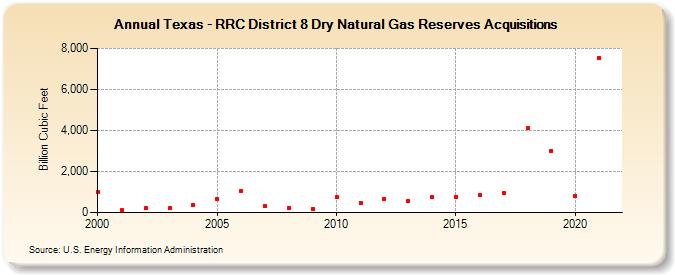
| Texas - RRC District 8 Dry Natural Gas Reserves Acquisitions (Billion Cubic Feet) | |||||
| Decade | Year-0 | Year-1 | Year-2 | Year-3 | Year-4 | Year-5 | Year-6 | Year-7 | Year-8 | Year-9 |
|---|---|---|---|---|---|---|---|---|---|---|
| 2000's | 1,022 | 117 | 206 | 207 | 372 | 664 | 1,065 | 321 | 232 | 194 |
| 2010's | 758 | 482 | 656 | 575 | 771 | 775 | 837 | 973 | 4,099 | 3,017 |
| 2020's | 812 | 7,546 |
| - = No Data Reported; -- = Not Applicable; NA = Not Available; W = Withheld to avoid disclosure of individual company data. |
| Release Date: 12/30/2022 |
| Next Release Date: NA |