|
Download Data (XLS File) |
|
|||||
|
|||||
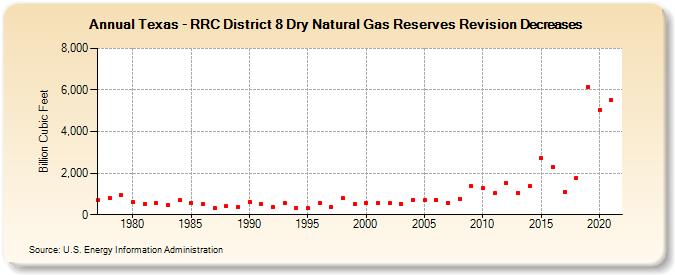
| Texas - RRC District 8 Dry Natural Gas Reserves Revision Decreases (Billion Cubic Feet) | |||||
| Decade | Year-0 | Year-1 | Year-2 | Year-3 | Year-4 | Year-5 | Year-6 | Year-7 | Year-8 | Year-9 |
|---|---|---|---|---|---|---|---|---|---|---|
| 1970's | 707 | 808 | 946 | |||||||
| 1980's | 619 | 513 | 567 | 460 | 687 | 581 | 498 | 308 | 405 | 382 |
| 1990's | 622 | 522 | 376 | 572 | 311 | 300 | 544 | 373 | 790 | 514 |
| 2000's | 561 | 569 | 548 | 532 | 730 | 692 | 714 | 558 | 773 | 1,375 |
| 2010's | 1,268 | 1,028 | 1,549 | 1,060 | 1,388 | 2,715 | 2,313 | 1,098 | 1,772 | 6,154 |
| 2020's | 5,052 | 5,516 |
| - = No Data Reported; -- = Not Applicable; NA = Not Available; W = Withheld to avoid disclosure of individual company data. |
| Release Date: 12/30/2022 |
| Next Release Date: NA |