|
Download Data (XLS File) |
|
|||||
|
|||||
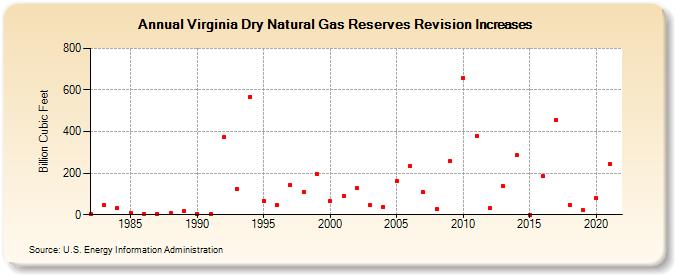
| Virginia Dry Natural Gas Reserves Revision Increases (Billion Cubic Feet) | |||||
| Decade | Year-0 | Year-1 | Year-2 | Year-3 | Year-4 | Year-5 | Year-6 | Year-7 | Year-8 | Year-9 |
|---|---|---|---|---|---|---|---|---|---|---|
| 1980's | 4 | 46 | 31 | 10 | 4 | 5 | 6 | 16 | ||
| 1990's | 4 | 2 | 373 | 125 | 568 | 67 | 46 | 142 | 111 | 198 |
| 2000's | 65 | 90 | 127 | 45 | 39 | 163 | 234 | 108 | 26 | 256 |
| 2010's | 658 | 378 | 32 | 137 | 286 | 1 | 184 | 457 | 46 | 22 |
| 2020's | 81 | 243 |
| - = No Data Reported; -- = Not Applicable; NA = Not Available; W = Withheld to avoid disclosure of individual company data. |
| Release Date: 12/30/2022 |
| Next Release Date: NA |