|
Download Data (XLS File) |
|
|||||
|
|||||
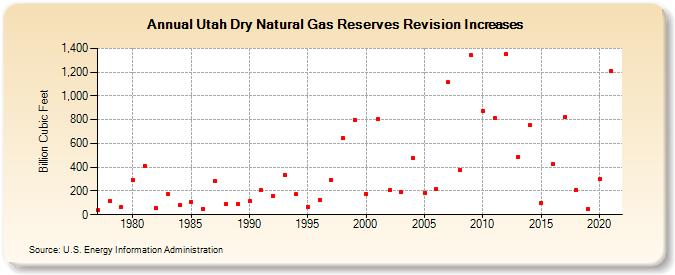
| Utah Dry Natural Gas Reserves Revision Increases (Billion Cubic Feet) | |||||
| Decade | Year-0 | Year-1 | Year-2 | Year-3 | Year-4 | Year-5 | Year-6 | Year-7 | Year-8 | Year-9 |
|---|---|---|---|---|---|---|---|---|---|---|
| 1970's | 37 | 117 | 62 | |||||||
| 1980's | 293 | 414 | 55 | 176 | 80 | 111 | 51 | 281 | 86 | 87 |
| 1990's | 112 | 204 | 161 | 337 | 172 | 69 | 125 | 293 | 645 | 801 |
| 2000's | 177 | 805 | 207 | 188 | 475 | 186 | 218 | 1,113 | 379 | 1,342 |
| 2010's | 872 | 813 | 1,349 | 484 | 752 | 97 | 426 | 819 | 211 | 50 |
| 2020's | 297 | 1,207 |
| - = No Data Reported; -- = Not Applicable; NA = Not Available; W = Withheld to avoid disclosure of individual company data. |
| Release Date: 12/30/2022 |
| Next Release Date: NA |