|
Download Data (XLS File) |
|
|||||
|
|||||
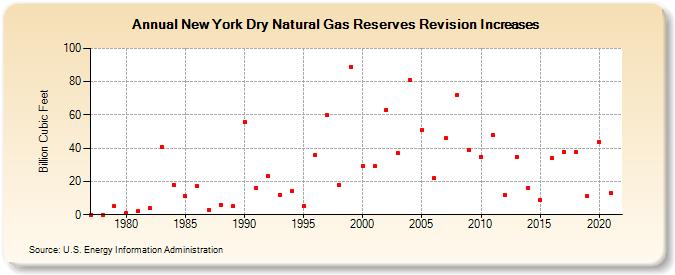
| New York Dry Natural Gas Reserves Revision Increases (Billion Cubic Feet) | |||||
| Decade | Year-0 | Year-1 | Year-2 | Year-3 | Year-4 | Year-5 | Year-6 | Year-7 | Year-8 | Year-9 |
|---|---|---|---|---|---|---|---|---|---|---|
| 1970's | 0 | 0 | 5 | |||||||
| 1980's | 1 | 2 | 4 | 41 | 18 | 11 | 17 | 3 | 6 | 5 |
| 1990's | 56 | 16 | 23 | 12 | 14 | 5 | 36 | 60 | 18 | 89 |
| 2000's | 29 | 29 | 63 | 37 | 81 | 51 | 22 | 46 | 72 | 39 |
| 2010's | 35 | 48 | 12 | 35 | 16 | 9 | 34 | 38 | 38 | 11 |
| 2020's | 44 | 13 |
| - = No Data Reported; -- = Not Applicable; NA = Not Available; W = Withheld to avoid disclosure of individual company data. |
| Release Date: 12/30/2022 |
| Next Release Date: NA |