|
Download Data (XLS File) |
|
|||||
|
|||||
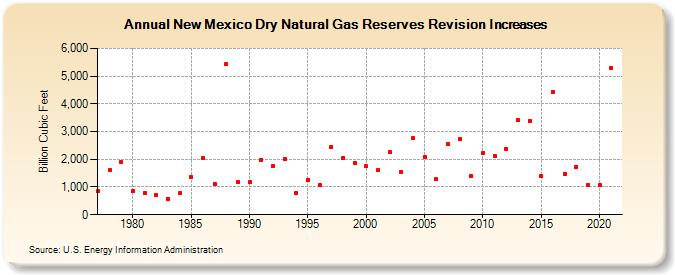
| New Mexico Dry Natural Gas Reserves Revision Increases (Billion Cubic Feet) | |||||
| Decade | Year-0 | Year-1 | Year-2 | Year-3 | Year-4 | Year-5 | Year-6 | Year-7 | Year-8 | Year-9 |
|---|---|---|---|---|---|---|---|---|---|---|
| 1970's | 850 | 1,599 | 1,910 | |||||||
| 1980's | 863 | 789 | 711 | 581 | 781 | 1,366 | 2,049 | 1,123 | 5,421 | 1,189 |
| 1990's | 1,171 | 1,984 | 1,757 | 2,000 | 801 | 1,267 | 1,074 | 2,459 | 2,040 | 1,882 |
| 2000's | 1,748 | 1,599 | 2,262 | 1,547 | 2,757 | 2,071 | 1,273 | 2,534 | 2,735 | 1,396 |
| 2010's | 2,211 | 2,114 | 2,384 | 3,407 | 3,394 | 1,394 | 4,443 | 1,479 | 1,722 | 1,076 |
| 2020's | 1,055 | 5,285 |
| - = No Data Reported; -- = Not Applicable; NA = Not Available; W = Withheld to avoid disclosure of individual company data. |
| Release Date: 12/30/2022 |
| Next Release Date: NA |