|
Download Data (XLS File) |
|
|||||
|
|||||
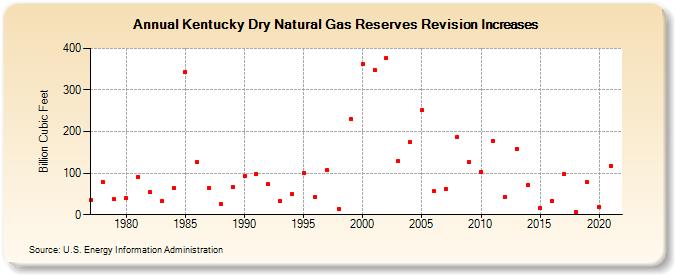
| Kentucky Dry Natural Gas Reserves Revision Increases (Billion Cubic Feet) | |||||
| Decade | Year-0 | Year-1 | Year-2 | Year-3 | Year-4 | Year-5 | Year-6 | Year-7 | Year-8 | Year-9 |
|---|---|---|---|---|---|---|---|---|---|---|
| 1970's | 35 | 79 | 37 | |||||||
| 1980's | 39 | 91 | 54 | 32 | 65 | 343 | 126 | 65 | 25 | 67 |
| 1990's | 93 | 99 | 73 | 34 | 49 | 100 | 43 | 107 | 14 | 230 |
| 2000's | 363 | 348 | 377 | 128 | 176 | 251 | 56 | 62 | 187 | 126 |
| 2010's | 103 | 178 | 43 | 159 | 72 | 15 | 33 | 98 | 7 | 78 |
| 2020's | 19 | 117 |
| - = No Data Reported; -- = Not Applicable; NA = Not Available; W = Withheld to avoid disclosure of individual company data. |
| Release Date: 12/30/2022 |
| Next Release Date: NA |