|
Download Data (XLS File) |
|
|||||
|
|||||
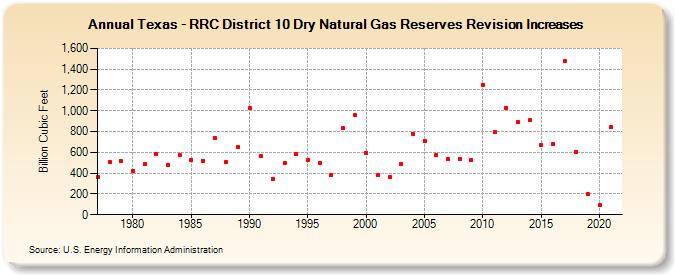
| Texas - RRC District 10 Dry Natural Gas Reserves Revision Increases (Billion Cubic Feet) | |||||
| Decade | Year-0 | Year-1 | Year-2 | Year-3 | Year-4 | Year-5 | Year-6 | Year-7 | Year-8 | Year-9 |
|---|---|---|---|---|---|---|---|---|---|---|
| 1970's | 361 | 508 | 515 | |||||||
| 1980's | 416 | 485 | 586 | 479 | 577 | 527 | 517 | 742 | 510 | 651 |
| 1990's | 1,022 | 567 | 348 | 500 | 584 | 528 | 499 | 384 | 834 | 958 |
| 2000's | 597 | 381 | 365 | 490 | 777 | 712 | 573 | 532 | 539 | 526 |
| 2010's | 1,252 | 795 | 1,022 | 891 | 910 | 669 | 684 | 1,477 | 608 | 198 |
| 2020's | 92 | 845 |
| - = No Data Reported; -- = Not Applicable; NA = Not Available; W = Withheld to avoid disclosure of individual company data. |
| Release Date: 12/30/2022 |
| Next Release Date: NA |