|
Download Data (XLS File) |
|
|||||
|
|||||
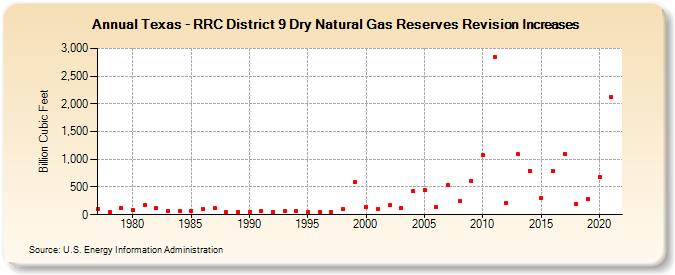
| Texas - RRC District 9 Dry Natural Gas Reserves Revision Increases (Billion Cubic Feet) | |||||
| Decade | Year-0 | Year-1 | Year-2 | Year-3 | Year-4 | Year-5 | Year-6 | Year-7 | Year-8 | Year-9 |
|---|---|---|---|---|---|---|---|---|---|---|
| 1970's | 108 | 50 | 130 | |||||||
| 1980's | 79 | 168 | 118 | 74 | 73 | 64 | 104 | 118 | 53 | 56 |
| 1990's | 46 | 68 | 45 | 66 | 58 | 48 | 53 | 47 | 100 | 584 |
| 2000's | 142 | 109 | 167 | 116 | 423 | 445 | 139 | 536 | 240 | 610 |
| 2010's | 1,070 | 2,850 | 212 | 1,087 | 793 | 297 | 793 | 1,104 | 202 | 277 |
| 2020's | 676 | 2,119 |
| - = No Data Reported; -- = Not Applicable; NA = Not Available; W = Withheld to avoid disclosure of individual company data. |
| Release Date: 12/30/2022 |
| Next Release Date: NA |