|
Download Data (XLS File) |
|
|||||
|
|||||
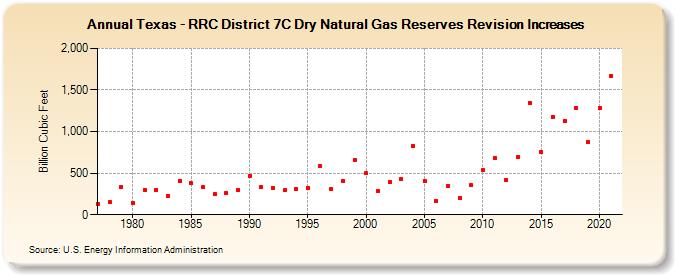
| Texas - RRC District 7C Dry Natural Gas Reserves Revision Increases (Billion Cubic Feet) | |||||
| Decade | Year-0 | Year-1 | Year-2 | Year-3 | Year-4 | Year-5 | Year-6 | Year-7 | Year-8 | Year-9 |
|---|---|---|---|---|---|---|---|---|---|---|
| 1970's | 131 | 154 | 339 | |||||||
| 1980's | 141 | 301 | 296 | 227 | 409 | 377 | 333 | 244 | 262 | 298 |
| 1990's | 471 | 335 | 324 | 293 | 309 | 327 | 585 | 305 | 401 | 659 |
| 2000's | 498 | 285 | 391 | 425 | 829 | 404 | 170 | 351 | 199 | 355 |
| 2010's | 535 | 684 | 421 | 693 | 1,343 | 755 | 1,179 | 1,132 | 1,282 | 874 |
| 2020's | 1,284 | 1,670 |
| - = No Data Reported; -- = Not Applicable; NA = Not Available; W = Withheld to avoid disclosure of individual company data. |
| Release Date: 12/30/2022 |
| Next Release Date: NA |