|
Download Data (XLS File) |
|
|||||
|
|||||
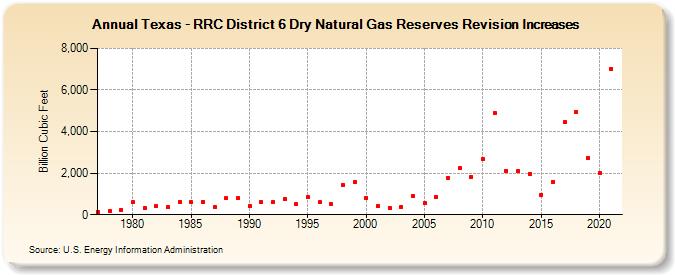
| Texas - RRC District 6 Dry Natural Gas Reserves Revision Increases (Billion Cubic Feet) | |||||
| Decade | Year-0 | Year-1 | Year-2 | Year-3 | Year-4 | Year-5 | Year-6 | Year-7 | Year-8 | Year-9 |
|---|---|---|---|---|---|---|---|---|---|---|
| 1970's | 148 | 155 | 233 | |||||||
| 1980's | 597 | 330 | 401 | 352 | 629 | 593 | 630 | 366 | 781 | 801 |
| 1990's | 418 | 590 | 604 | 762 | 495 | 851 | 610 | 503 | 1,439 | 1,557 |
| 2000's | 817 | 408 | 342 | 383 | 891 | 548 | 854 | 1,780 | 2,231 | 1,820 |
| 2010's | 2,660 | 4,894 | 2,108 | 2,089 | 1,979 | 969 | 1,596 | 4,439 | 4,936 | 2,739 |
| 2020's | 2,016 | 7,022 |
| - = No Data Reported; -- = Not Applicable; NA = Not Available; W = Withheld to avoid disclosure of individual company data. |
| Release Date: 12/30/2022 |
| Next Release Date: NA |