|
Download Data (XLS File) |
|
|||||
|
|||||
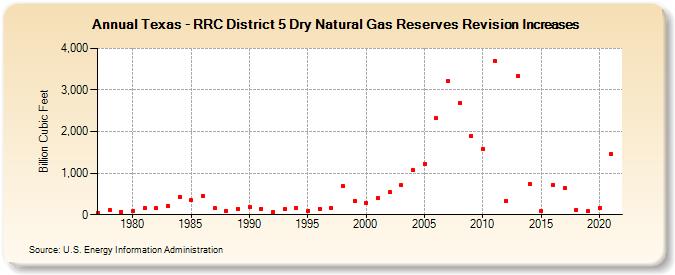
| Texas - RRC District 5 Dry Natural Gas Reserves Revision Increases (Billion Cubic Feet) | |||||
| Decade | Year-0 | Year-1 | Year-2 | Year-3 | Year-4 | Year-5 | Year-6 | Year-7 | Year-8 | Year-9 |
|---|---|---|---|---|---|---|---|---|---|---|
| 1970's | 51 | 110 | 75 | |||||||
| 1980's | 83 | 164 | 155 | 214 | 435 | 347 | 459 | 151 | 101 | 147 |
| 1990's | 180 | 147 | 55 | 130 | 170 | 97 | 144 | 163 | 689 | 334 |
| 2000's | 293 | 398 | 539 | 706 | 1,068 | 1,216 | 2,318 | 3,223 | 2,689 | 1,904 |
| 2010's | 1,577 | 3,693 | 336 | 3,338 | 740 | 94 | 723 | 642 | 115 | 80 |
| 2020's | 167 | 1,456 |
| - = No Data Reported; -- = Not Applicable; NA = Not Available; W = Withheld to avoid disclosure of individual company data. |
| Release Date: 12/30/2022 |
| Next Release Date: NA |